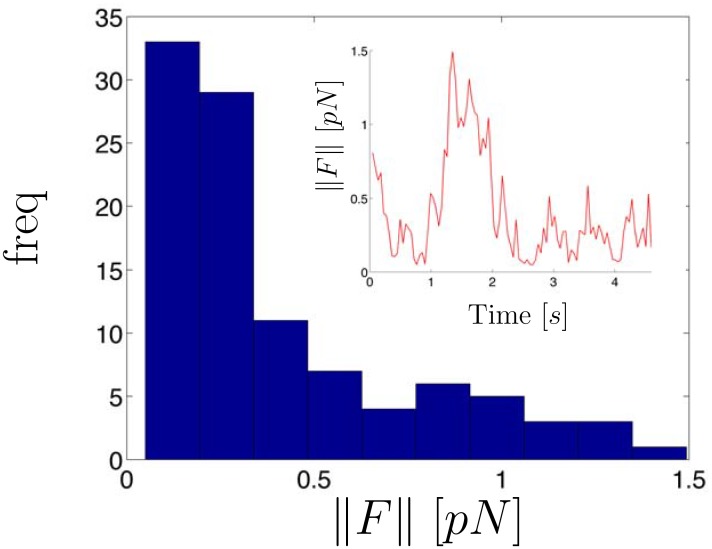
Fig 2. Histogram of inferred force magnitudes computed from experimental chromatid position vs. time data.
The inset displays the force trajectory. Forces were computed using HDP-SLDS state segmentation and Kalman filtering (see text for details). The white light image of cell with the position vs. time data measured from the GFP channel is shown in Fig 3.

