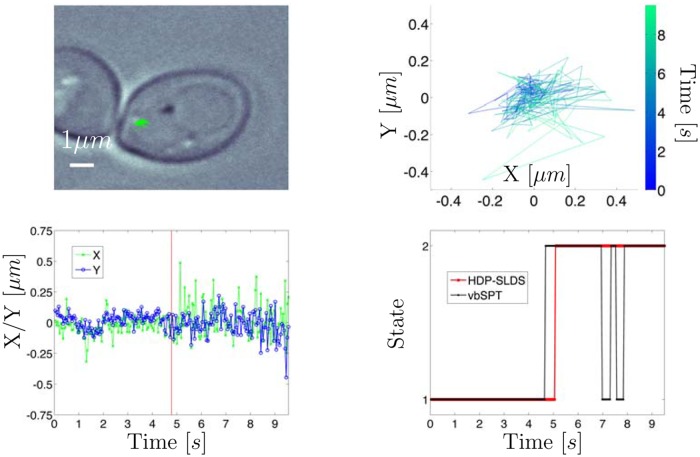
Fig 3. Experimental trajectory of GFP tagged chromatid in yeast.
Top left panel: White light image where green lines denote the SPT trajectory measured via the GFP channel. Top right panel: Zoomed snapshot of trajectory shown in white light image; time is color coded. Bottom left panel: X/Y vs. time for trajectory. Vertical red line denotes the time point at which the HDP-SLDS inferred a state change. Bottom right panel: HDP-SLDS [32] and vbSPT [21] state estimates.

