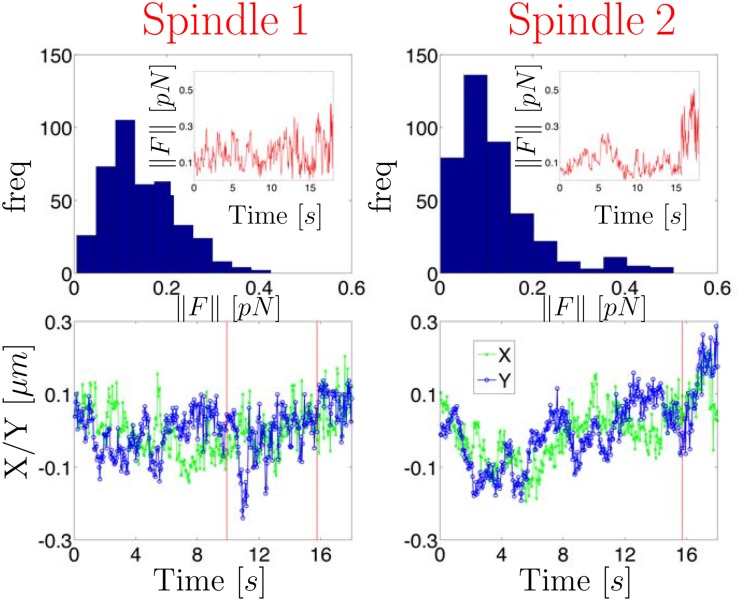
Fig 5. Analysis of two sister chromatid trajectories in the metaphase of mitosis (each column shows results of one chromatid).
Spatial location of the spindle pole bodies (SPB) and the two sister chromatid trajectories are displayed in Fig 6. The top row displays the forces inferred using the Kalman filter analysis discussed in the main text. The bottom row displays the measured trajectories vs. time as well as the time point of the state changes predicted by the HDP-SLDS approach.

