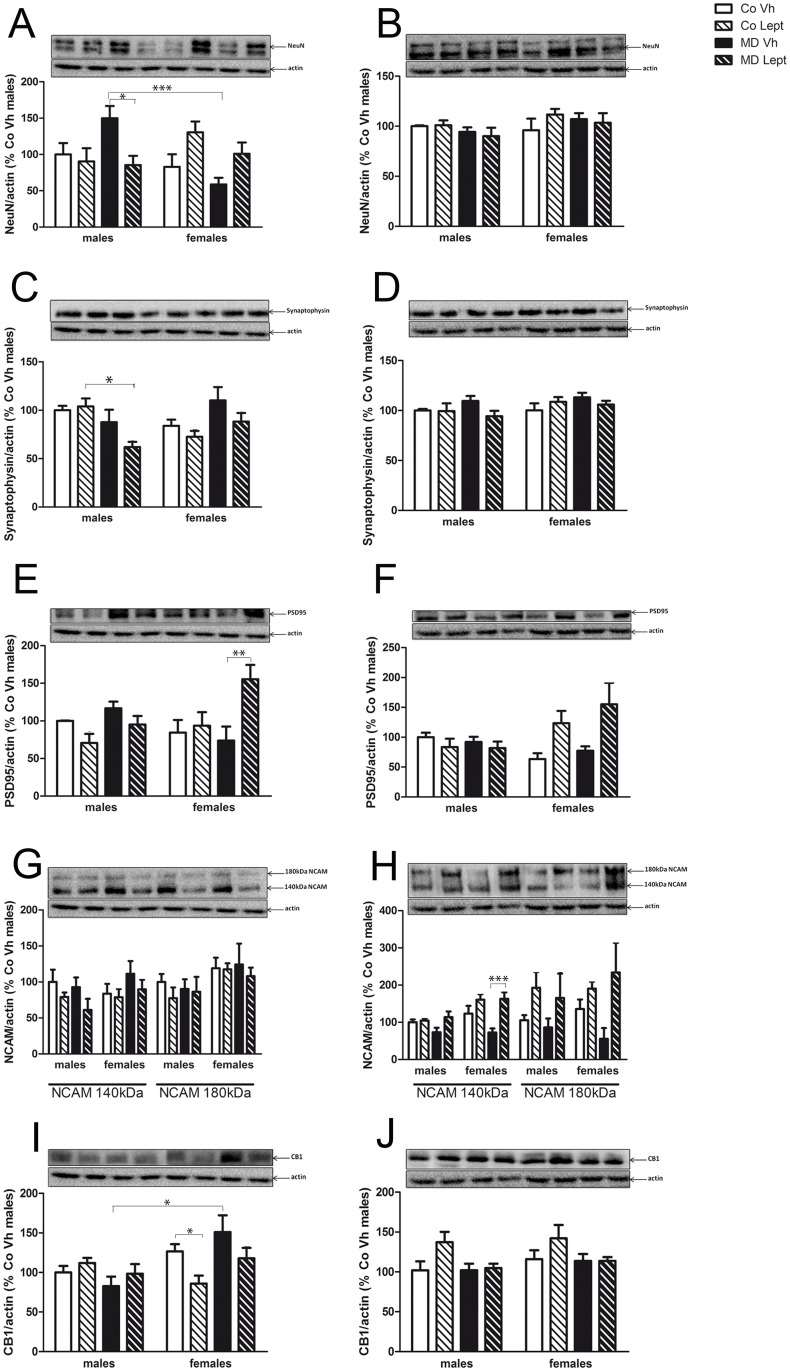
Fig 4. Protein levels in the hippocampus (left column) and frontal cortex (right column) of NeuN (A & B), synaptophysin (C & D), PSD95 (E & F), NCAM (G & H) and CB1 receptor (I & J) in maternally deprived (MD) or control (Co) male and female rats treated with leptin (Lept) or vehicle (Vh) from postnatal day (PND) 9 until PND13 (n = 5–6).
Representative western blotting immunoassays of each protein from tissue homogenates of each brain area are presented above each histogram. Post hoc test: *<0.05, **<0.01, ***<0.005.

