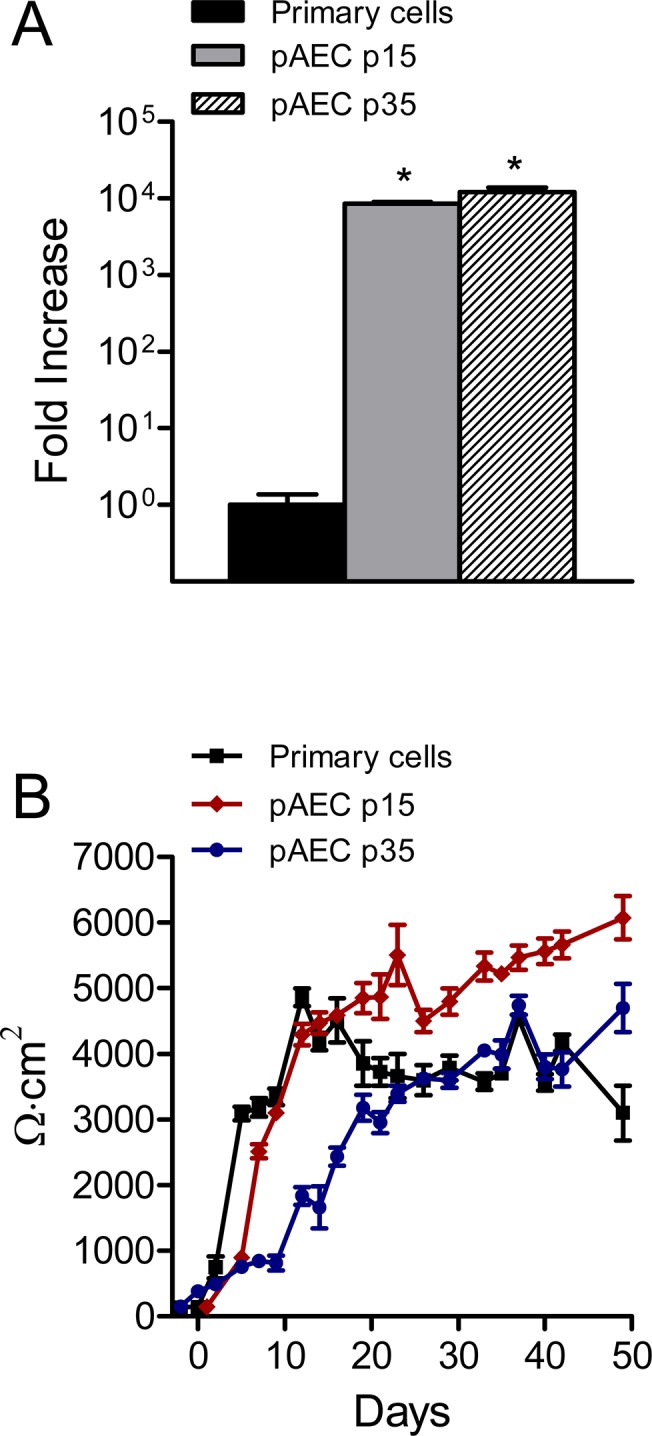
Fig 2. Telomerase expression and development of transepithelial resistance.

(A) Normalized RT-qPCR data comparing levels of hTERT mRNA expression in primary, passage 15 and passage 35 pAECs (n = 6). Immortalized passage 15 and 35 cells had significantly higher levels of expression compared to primary cells (*p < 0.01). (B) Changes in transepithelial resistance (TER) over a time course of 50 days after seeding onto Snapwell® membrane filters (n = 6 for each condition). Although passage 35 cells exhibited a slower increase in TER for the first 20 days, the steady-state TER was very similar to primary cells for the remaining 30 days.
