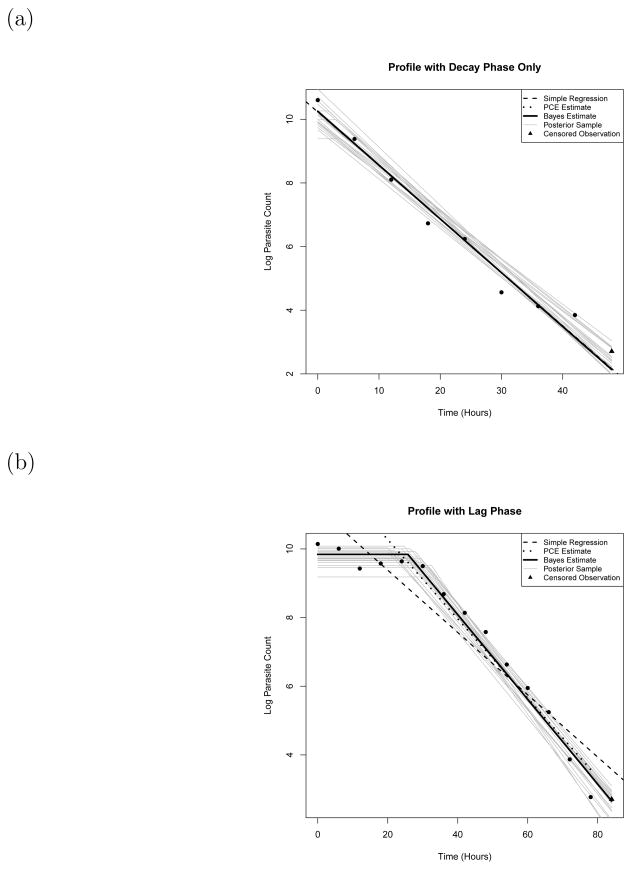
Figure 1.
Examples of posterior log parasitemia profiles. The first profile (a) is identified as only having a decay phase, whereas the second (b) is identified as having a lag phase before the decay occurs. The gray lines are various posterior samples. The solid black line represents the posterior mean clearance rate from our Bayesian procedure. The dotted black line is the fit given by the PCE. The dashed black line is the fit given by a simple to bit regression without lag and tail phases. The triangles are censored observations due to the detection limit

