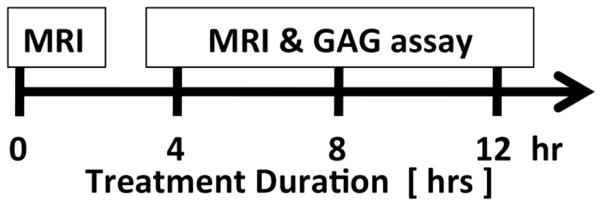
Figure 2.


(A) Study design. (B) Meniscal morphologic and signal changes on PD-weighted imaging, after progressive enzymatic GAG digestion. The image at t=0h (prior to enzymatic digestion) depicts the detailed collagen fiber network as well as the normal triangular shape of the meniscal horn. As the trypsin digestion time progresses (from t=4h to t=12h), progressive shape and contour changes are observed (secondary to swelling), as well as fiber disorganization and increase in signal intensity (related to GAG depletion). (C) UTE-T1ρ images profile similar morphologic changes with increasing digestion times, but clearly have increased signal as compared with the PD-weighted images. (D) UTE-T1ρ color maps show altered quantitative values corresponding to the morphologic changes.
