Figure 3.

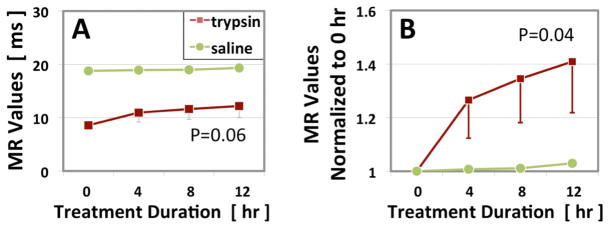
Changes in (A) raw and (B) normalized UTE-T1ρ MR values of the three trypsin- and single saline-treated specimens at each time point (mean ± standard error of the mean).

Changes in (A) raw and (B) normalized UTE-T1ρ MR values of the three trypsin- and single saline-treated specimens at each time point (mean ± standard error of the mean).