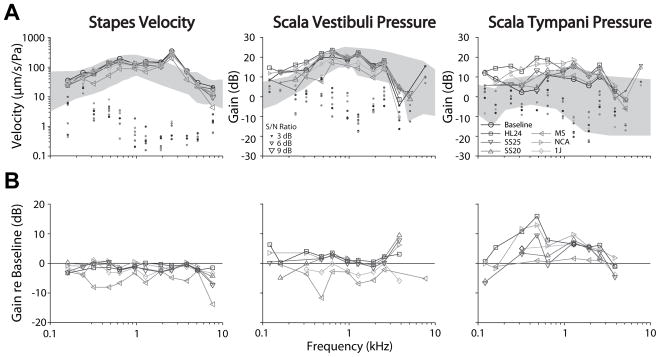
Figure 2.

An example set of recordings in one representative specimen (249L). (A.) Baseline transfer functions are represented by circles, while transfer functions recorded with various CI electrodes shown in the legend. (B.) Difference in transfer function magnitude recorded with each CI electrode inserted compared to the baseline for the same specimen as in (A.). Responses are shown in units of dB difference from baseline as a function of stimulus frequency. Symbol size indicates the signal to noise ratio (small: > 3 dB, medium: > 6 dB, large: > 9 dB), and dots show the noise floor for each measurement (normalized as: noise/PEC during sound stimulation). Nucleus Hybrid L24 (HL24), Nucleus CI422 Slim Straight inserted at 20 and 25 mm (SS20 & SS25), Nucleus CI24RE Contour Advance (NCA), HiFocus Mid-Scala (MS), and HiFocus 1j (1j).
