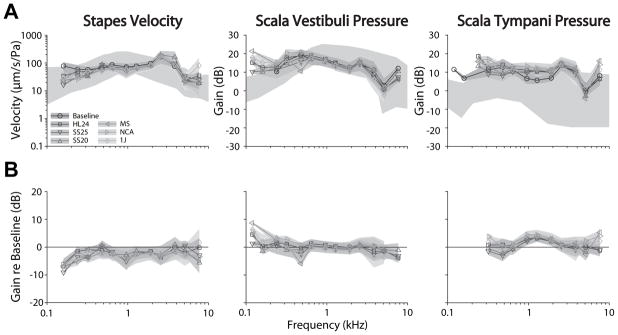
Figure 3.

Analysis of the responses across the population of specimens is shown. (A.) The mean (± SEM; gray bands) transfer functions across specimens, recorded under baseline (circles) and CI electrode inserted conditions (symbols) for VStap (left), PSV (center) and PST (right) magnitudes. Responses are shown superimposed over the same range of responses shown in prior reports (dark gray bands) (23,35). (B) The mean (± SEM) differences (in dB re: baseline) compared to baseline across all specimens tested. Nucleus Hybrid L24 (HL24), Nucleus CI422 Slim Straight inserted at 20 and 25 mm (SS20 & SS25), Nucleus CI24RE Contour Advance (NCA), HiFocus Mid-Scala (MS), and HiFocus 1j (1j).
