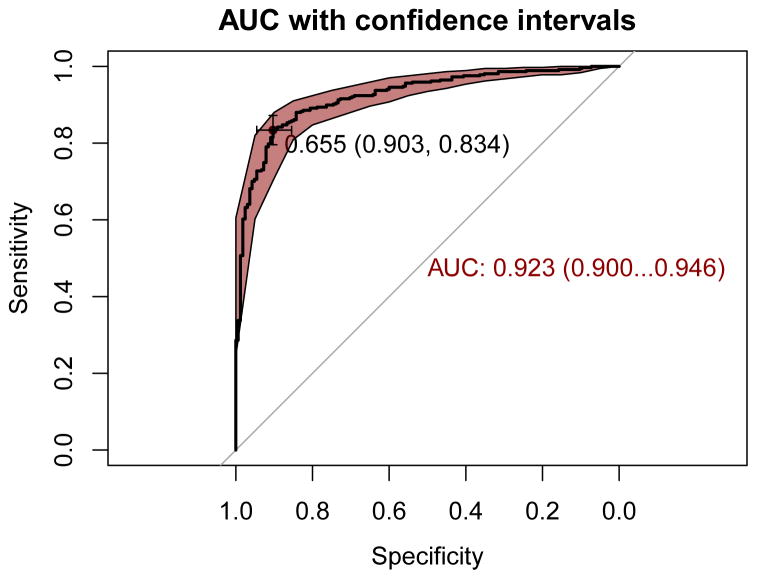
Figure 2. Receiver operating characteristic curves.
The receiver operating characteristic curve for the integrative model as developed in PPMI. The red shading denotes the bootstrap estimated 95% confidence interval with the AUC: its corresponding 95% confidence interval estimate is highlighted in red text. The optimal threshold for classification is indicated by the cross-hairs with black text annotating this threshold value followed by specificity and sensitivity.

