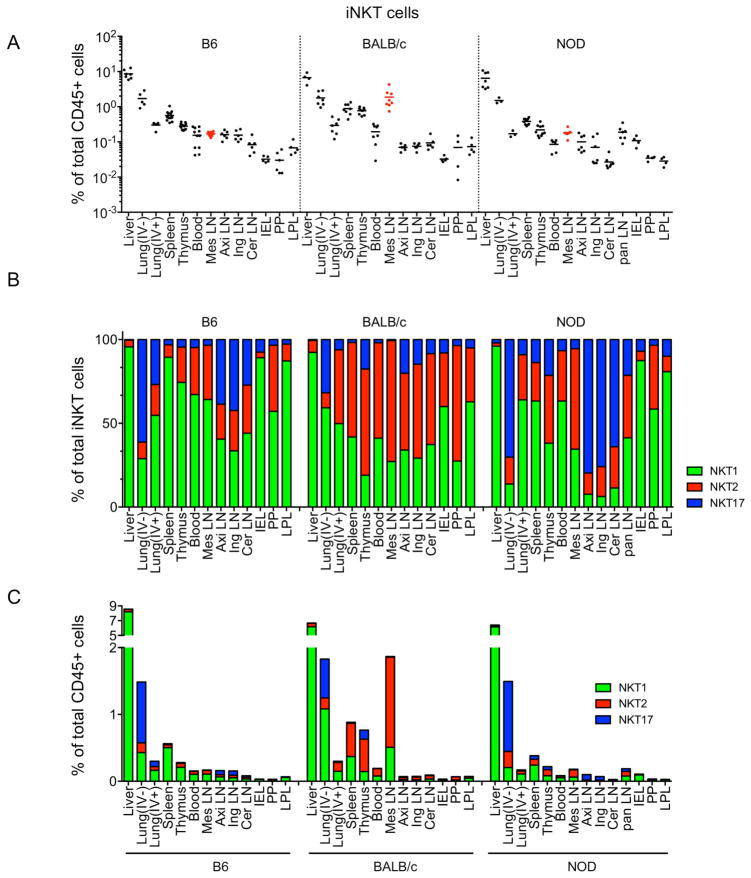
Figure 3.
iNKT subsets have unique peripheral distribution, with some interstrain variation. Frequencies of total iNKT cells among total CD45+ cells (A), mean frequencies of iNKT subsets among total iNKT cells (B) and frequency of iNKT subsets among total CD45+ cells (C) are shown in indicated organs and strains of mice. IV−; intravenous antibody unlabeled, IV+; intravenous antibody labeled, Mes; Mesenteric, Axi; Axillary, Ing; Inguinal, Cer; Cervical, Pan; Pancreas, IEL; Intra-Epithelial Lymphocytes, PP; Peyer’s Patches, LPL; Lamina Propria Lymphocytes. Each symbol represents an individual mouse (n = 4 ~ 9) and horizontal bars indicate mean values. Pooled data from 8 independent experiments are shown. See also Figure S3.

