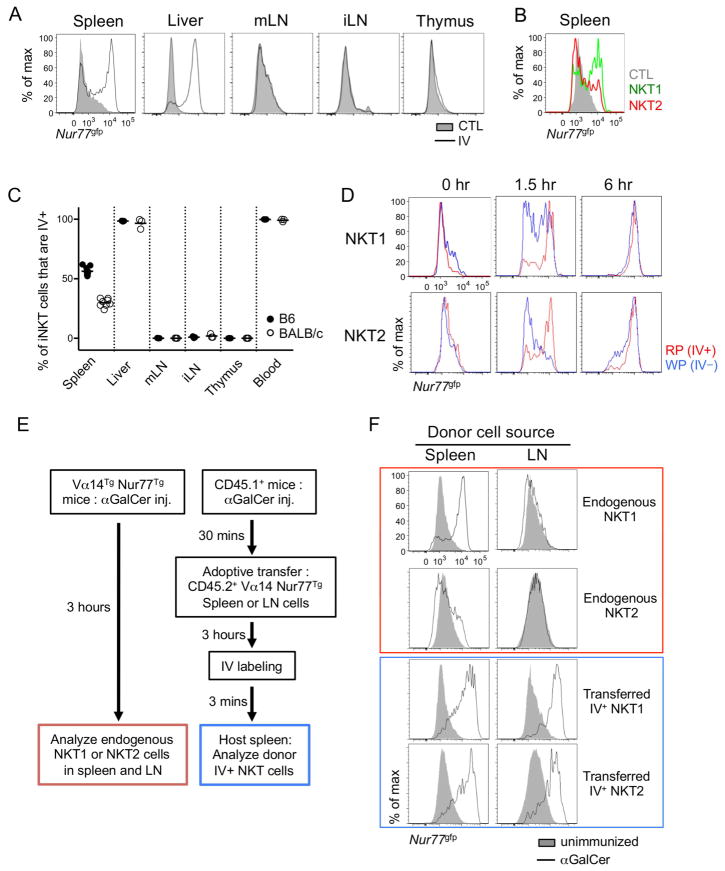
Figure 6.
Vascular localized NKT1 cells respond rapidly to αGalCer challenge. (A) BALB/c Nur77gfp mouse was intravenously (IV) injected with αGalCer and indicated organs were collected 3 hours later. Overlaid histograms show Nur77gfp expression in total iNKT cells from αGalCer IV injected and uninjected control (CTL) mice. Representative histograms of at least five independent experiments are shown. All histograms have the same axis scales. mLN, mesenteric lymph node; iLN, inguinal lymph node. (B) Overlaid histogram shows Nur77gfp expression in NKT1 (green) and NKT2 (red) cells 3 hours after αGalCer IV injection in BALB/c mice. Representative histogram of at least five independent experiments is shown. (C) Percentages of iNKT cells labeled with IV anti-CD45 antibody in corresponding organs of B6 (n = 3 ~ 8) and BALB/c (n = 3 ~ 7) mice are shown. Each dot represents an individual mouse and horizontal bars indicate mean values. (D) BALB/c Nur77gfp mice were IV injected with αGalCer and labeled with IV ant-CD45 antibody after indicated time periods. Three minutes later, mice were sacrificed and analyzed for Nur77gfp expressions. All histograms have the same axis scales. Representative results of three independent experiments are shown. RP, red pulp; WP, white pulp. (E) Schematic representation shows experimental procedure for (F). Vα14Tg Nur77gfp (left) or CD45.1+ congenic B6 (right) mice were IV injected with αGalCer and the latters were transferred with LN cells of Vα14Tg Nur77gfp mice. Three hours later, mice were sacrificed after CD45.1+ congenic B6 recipient mice were labeled with IV anti-CD45 antibody for 3 minutes. (F) Histograms show Nur77 expression of NKT1 and NKT2 cells of spleen and LN of Vα14Tg Nur77gfp mice (red) and donor iNKT cells in splenic red pulp of host mice immunized (blue). Filled histogram shows Nur77 expression of NKT1 and NKT2 cells in unimmunized Vα14Tg Nur77gfp mice. All histograms have the same axis scales. Representative data of three mice are shown. See also Figure S6.

