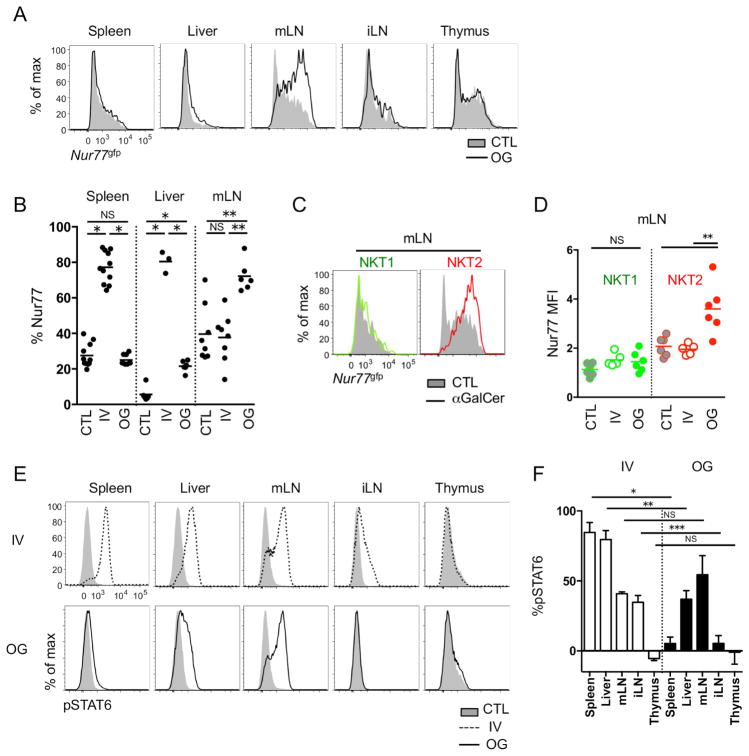
Figure 7.
mLN NKT2 cells respond to oral administration of αGalCer. (A) BALB/c Nur77gfp mice were oral gavaged (OG) with 2μg of αGalCer and Nur77gfp expressions in total iNKT cells were analyzed after 24 hours. All histograms have the same axis scales. Representative histograms of at least five independent experiments are shown. mLN, mesenteric lymph node; iLN, inguinal lymph node. (B) Statistical analyses show frequencies of iNKT cells expressing Nur77gfp in spleen, liver and mLN of unimmunized control (CTL), intravenously (IV) αGalCer injected and oral gavaged (OG) BALB/c mice (n = 3 ~ 9). *p<0.0001, **p=0.0002 (one-way analysis of variance (ANOVA)). NS, not significant. Each dot represents an individual mouse and horizontal bars indicate mean values. (C and D) Overlay histograms show Nur77gfp expressions in NKT1 (green) and NKT2 (red) cells in BALB/c mice 24 hours after αGalCer oral gavage. Representative histograms of three independent experiments (C) and its statistical analysis (n = 6) (D) are shown. All histograms have the same axis scales. **p=0.001 (unpaired t-test). NS, not significant. Each dot represents an individual mouse and horizontal bars indicate mean values. (E) Histograms show pSTAT6 expression in CD4 T cells 3 hours after IV injection (IV, top) or 24 hours after oral gavage (OG, bottom) of αGalCer. All histograms have the same axis scales. (F) Bar graphs show average percent point increases of pSTAT6 expression in CD4 T cells after IV injection or OG of αGalCer in BALB/c mice (n = 3 ~ 6). *p<0.0001, **p=0.0014, ***p=0.0033 (unpaired t-test). NS, not significant. Error bars show standard deviation. See also Figure S7.

