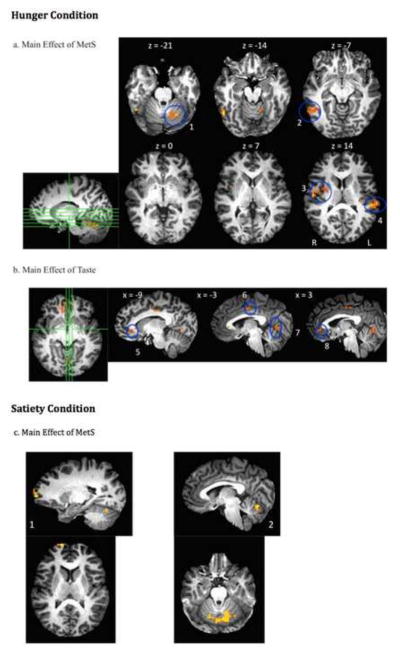
Figure 1.
Main effects of metabolic syndrome and taste: (a) Statistical map of the main effect (F values) of metabolic syndrome during hunger (controls > MetS) in left cerebellum(1), right inferior temporal gyrus/BA 20, fusiform gyrus(2), right lentiform nucleus, insula, putamen(3), and left superior temporal gyrus/BA 42, insula(4). (b) Statistical map of the main effect (F values) of taste, during hunger, in the left anterior cingulate (sucrose > caffeine)(5), right paracentral lobule and left cingulate gyrus (caffeine > sucrose)(6), left lingual gyrus (caffeine > sucrose)(7), and right anterior cingulate and Brodmann Area 10 (sucrose > caffeine)(8). (c) Statistical map of the main effect of metabolic syndrome during satiety. Healthy controls demonstrated greater activation than the group with MetS in the right prefrontal cortex/Brodmann Area 10(1) and Cerebellum(2).

