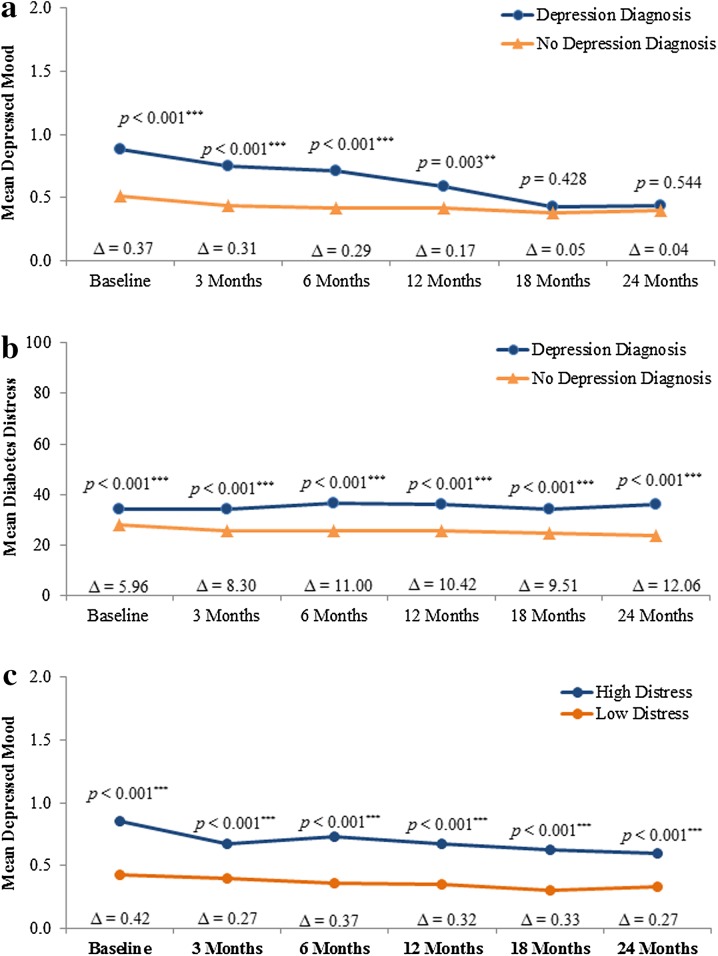
Fig. 3.
a Depressed mood scores over 24 months by history of depression diagnosis at baseline. Results are presented from the unadjusted analysis. Results from the adjusted analysis showed the same pattern as the unadjusted analysis. Group differences were, however, no longer statistically significant at 12 months. b Diabetes distress scores over 24 months by history of depression diagnosis at baseline. Results are presented from the unadjusted analysis. Results from the adjusted analysis showed the same pattern as the unadjusted analysis. Group differences were, however, no longer statistically significant at baseline. c Depressed mood scores over 24 months by diabetes distress. Results are presented from the unadjusted analysis. Results from the adjusted analysis showed the same pattern as the unadjusted analysis. *Significant difference between the groups with vs. without the depression parameter at p ≤ 0.05. **Significant difference between the groups with vs. without the depression parameter at p ≤ 0.01. ***Significant difference between the groups with vs. without the depression parameter at p ≤ 0.001. ∆ = Difference between groups

