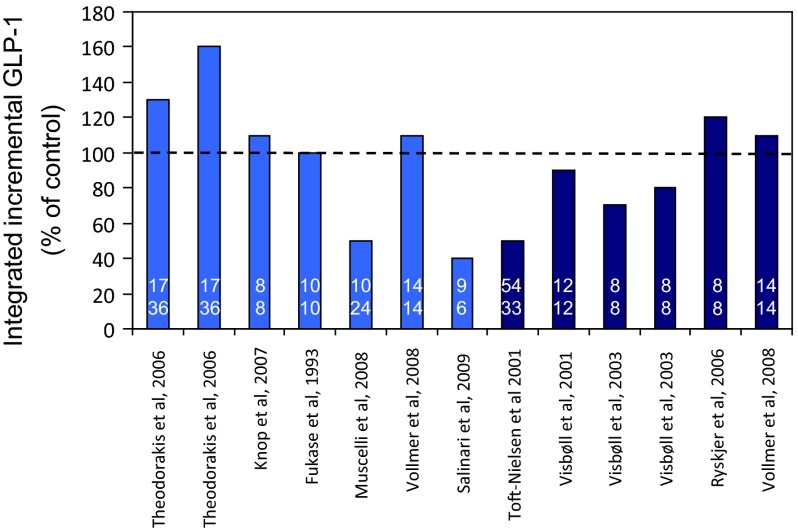
Fig. 2.
Responses of "total" GLP to oral glucose or mixed meals in patients with T2DM and control subjects. Integrated responses of "total" GLP to oral glucose or mixed meals based on individual studies reporting integrated incremental "total" GLP-1 responses in patients with T2DM and an appropriate control group (weight-matched, non-diabetic participants) and using non-specific assays that measured intact and DPP-4-degraded forms of GLP-1. The response in patients with T2DM (mean ± SEM) is expressed as percentage of the mean value in the control group. *P < 0.05 versus control. The numbers in bars indicate the number of patients with T2DM (upper row) and control participants (lower row) studied. Light blue oral glucose, dark blue mixed meal. DPP-4 dipeptidyl peptidase-4, GLP glucagon-like peptide, T2DM type 2 diabetes mellitus, SEM standard error of mean. Modified with permission from Nauck et al. [19]

