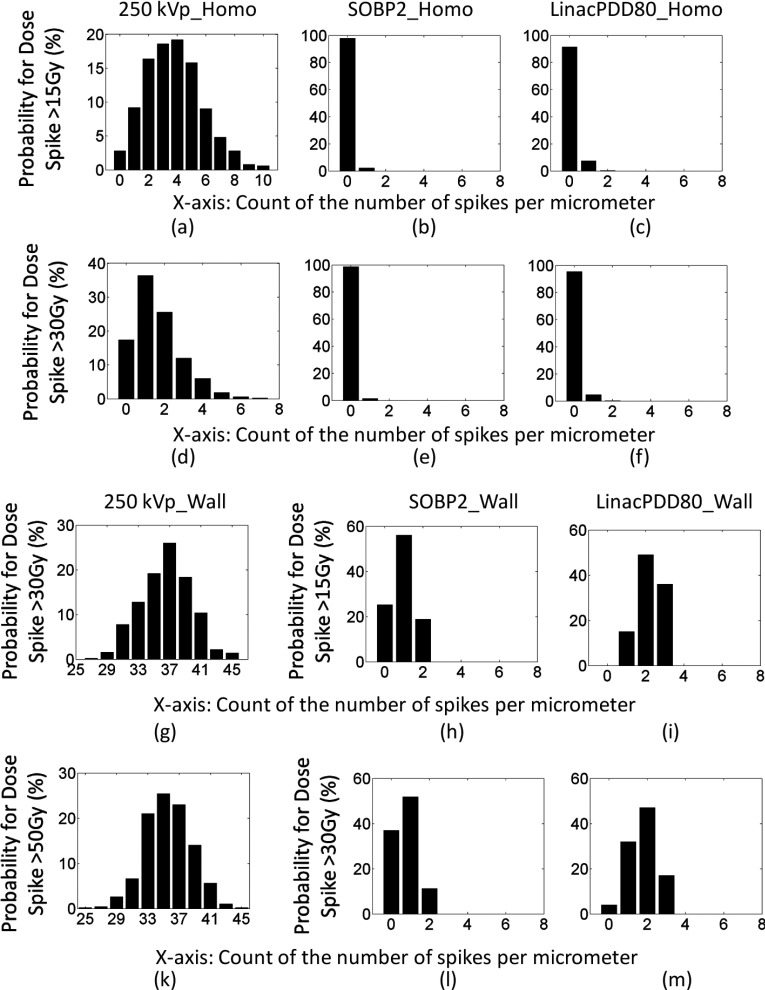
FIG. 11.
The probability of having high dose spikes for 30 Gy prescribed dose. The x-axis is the number of dose spikes. The y-axis is the probability in percentage. For instance, (a) shows that the chance of having 5 spikes per slice of 1 μm vessel that are higher than 15 Gy is about 16% and the chance of having 10 spikes per slice of 1 μm vessel that are higher than 15 Gy is about 1%. (a)–(f) show the probability for high dose spikes for GNPs homogeneously distributed in the vessel. (g)–(m) show the probability for high dose spikes for GNPs constrained to the inner vascular wall of the lumen.

