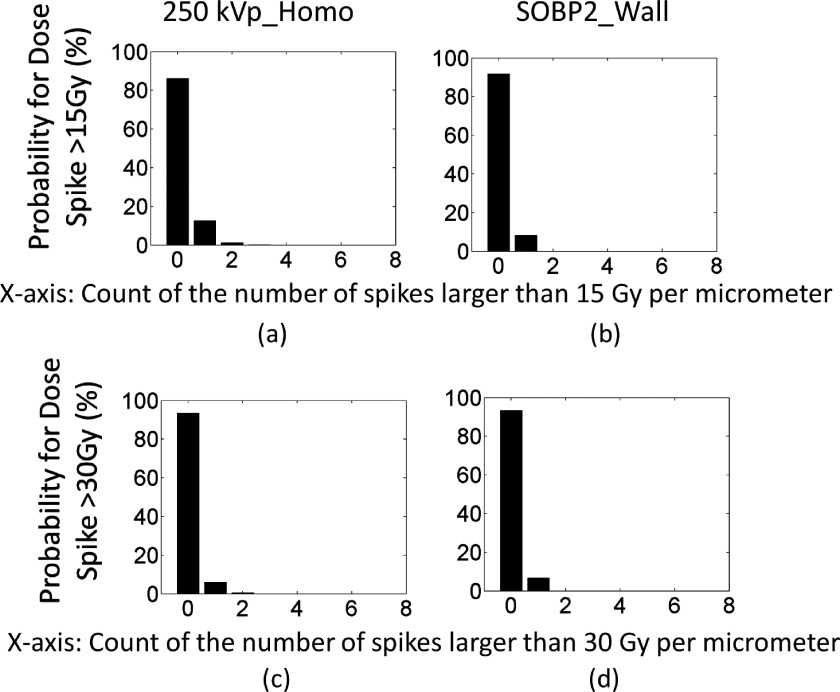
FIG. 12.
The probability of having high dose spikes for 2 Gy prescribed dose. The x-axis is the number of dose spikes higher than 15 or 30 Gy. The y-axis is the probability in percentage. (a) and (b) show the probability for spikes higher than 15 Gy. (c) and (d) show the probability for spikes higher than 30 Gy.

