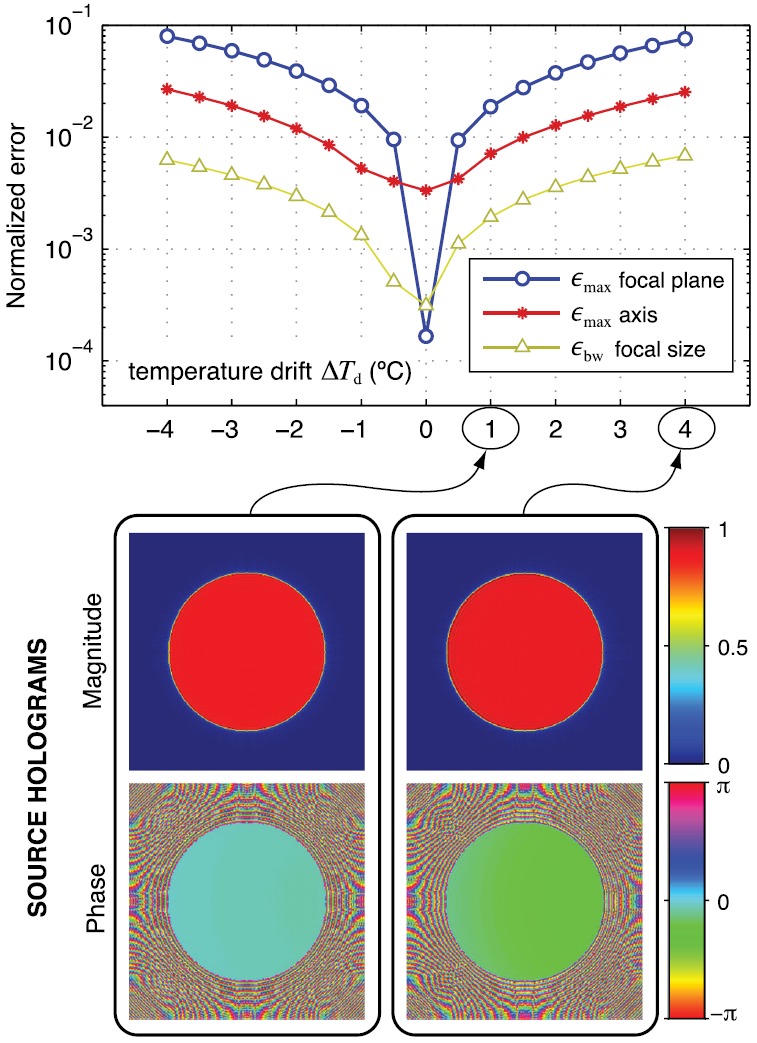
FIG. 10.

(Color online) Field reconstruction errors (top) for the focused source as a function of the amount of temperature drift that occurs during the acquisition of measurements by a raster scan. Temperature is assumed to change linearly with the scan point number. The measurement region is at mm with aperture mm. Bottom images illustrate reconstructed source holograms for the indicated temperature changes.
