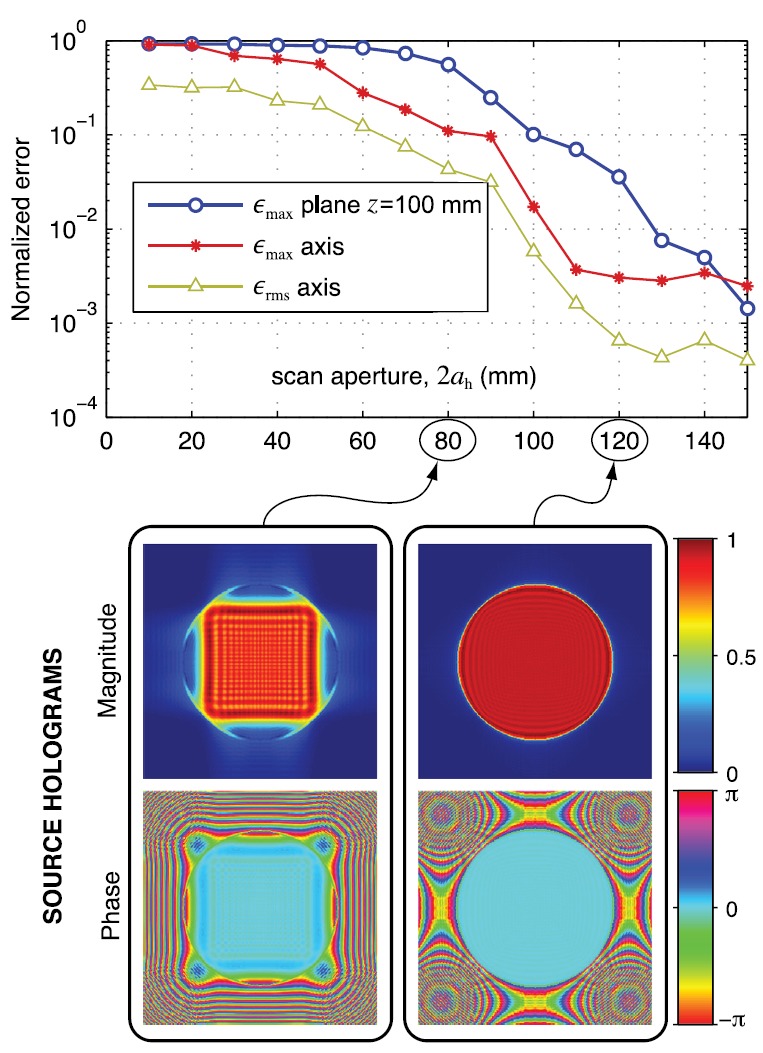
FIG. 4.

(Color online) Field reconstruction errors (top) for the flat source (100 mm aperture) as a function of the size of the measurement region. This region is a square with its center placed on the acoustic axis at mm. Bottom images illustrate the reconstructed source hologram in terms of velocity magnitude and phase distributions for two possible sizes of the measurement region (corresponding measurement apertures are circled).
