
Fig. 8.
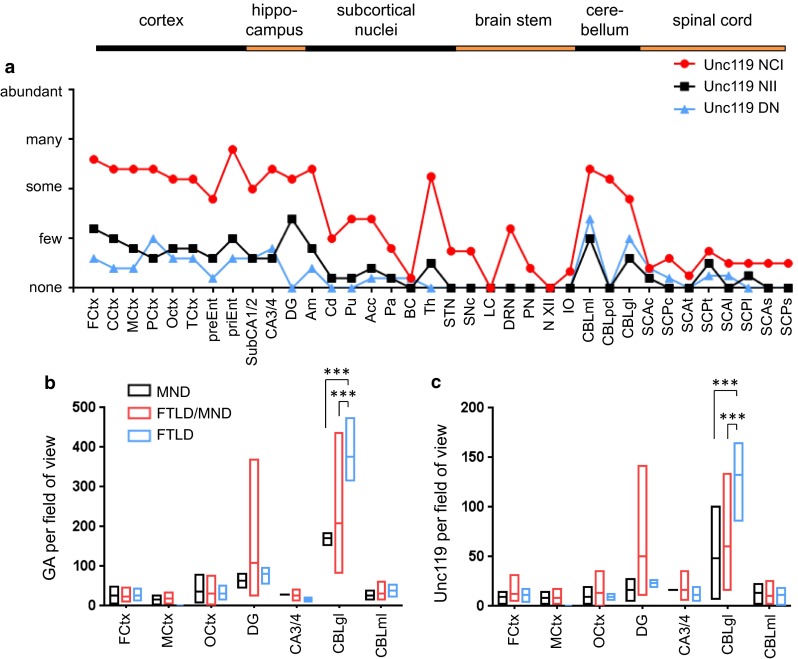
Distribution of poly-GA and Unc119 inclusion pathology depends on pathological subtypes. a Semi-quantitative analysis of Unc119 neuronal cytoplasmic inclusions (NCI), neuronal intranuclear inclusions (NII) and dystrophic neurites (DN) in representative cortical, hippocampal, subcortical, brain stem, cerebellar and spinal cord areas of five C9orf72 mutation patients. The regional distribution of Unc119 inclusions resembles the pattern of poly-GA pathology (Fig. 5), albeit at overall lower abundance. Semi-quantitative analysis is explained in detail in the “Materials and methods” section. Abbreviations as in Fig. 5. b, c Quantitative analysis of NCI and NII of poly-GA and Unc119 pathology by immunohistochemistry in C9orf72 mutation patients with MND (n = 2–3), FTLD (n = 3, no MtCtx) and combined FTLD/MND (n = 4–8) cases as in Fig. 6. The graphs show the minimum, mean and maximum number of poly-GA and Unc119 inclusions averaged per visual field. Poly-GA distributions are significantly different between FTLD, FTLD/MND and MND patients in granular layer of cerebellum (p(FTLD vs. FTLD/MND) = 0.0003, p(FTLD vs. MND) = 0.0003) (b). Similarly, the frequency of Unc119 inclusions is different in the granular layer of cerebellum in FTLD patients compared with FTLD/MND and MND (p(FTLD vs. FTLD/MND) = 0.0005, p(FTLD vs. MND) = 0.0008) (c). Quantitative analysis is explained in detail in the “Materials and methods” section, the data for individual cases are presented in Table S2. Abbreviations as in Fig. 6