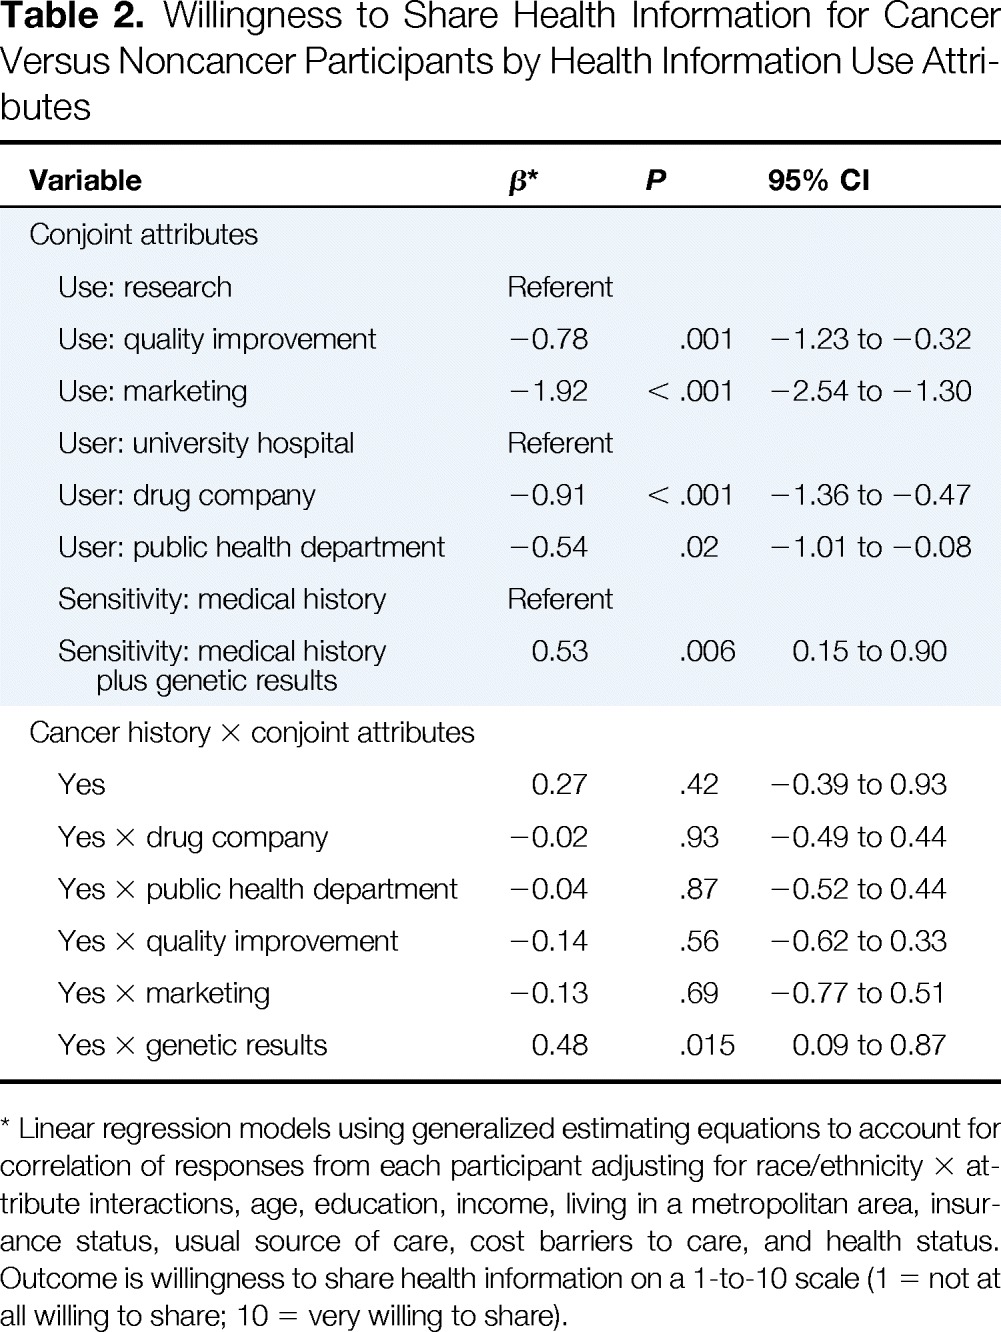
Table 2.
Willingness to Share Health Information for Cancer Versus Noncancer Participants by Health Information Use Attributes

| Variable | β* | P | 95% CI |
|---|---|---|---|
| Conjoint attributes | |||
| Use: research | Referent | ||
| Use: quality improvement | −0.78 | .001 | −1.23 to −0.32 |
| Use: marketing | −1.92 | < .001 | −2.54 to −1.30 |
| User: university hospital | Referent | ||
| User: drug company | −0.91 | < .001 | −1.36 to −0.47 |
| User: public health department | −0.54 | .02 | −1.01 to −0.08 |
| Sensitivity: medical history | Referent | ||
| Sensitivity: medical history plus genetic results | 0.53 | .006 | 0.15 to 0.90 |
| Cancer history × conjoint attributes | |||
| Yes | 0.27 | .42 | −0.39 to 0.93 |
| Yes × drug company | −0.02 | .93 | −0.49 to 0.44 |
| Yes × public health department | −0.04 | .87 | −0.52 to 0.44 |
| Yes × quality improvement | −0.14 | .56 | −0.62 to 0.33 |
| Yes × marketing | −0.13 | .69 | −0.77 to 0.51 |
| Yes × genetic results | 0.48 | .015 | 0.09 to 0.87 |
Linear regression models using generalized estimating equations to account for correlation of responses from each participant adjusting for race/ethnicity × attribute interactions, age, education, income, living in a metropolitan area, insurance status, usual source of care, cost barriers to care, and health status. Outcome is willingness to share health information on a 1-to-10 scale (1 = not at all willing to share; 10 = very willing to share).
