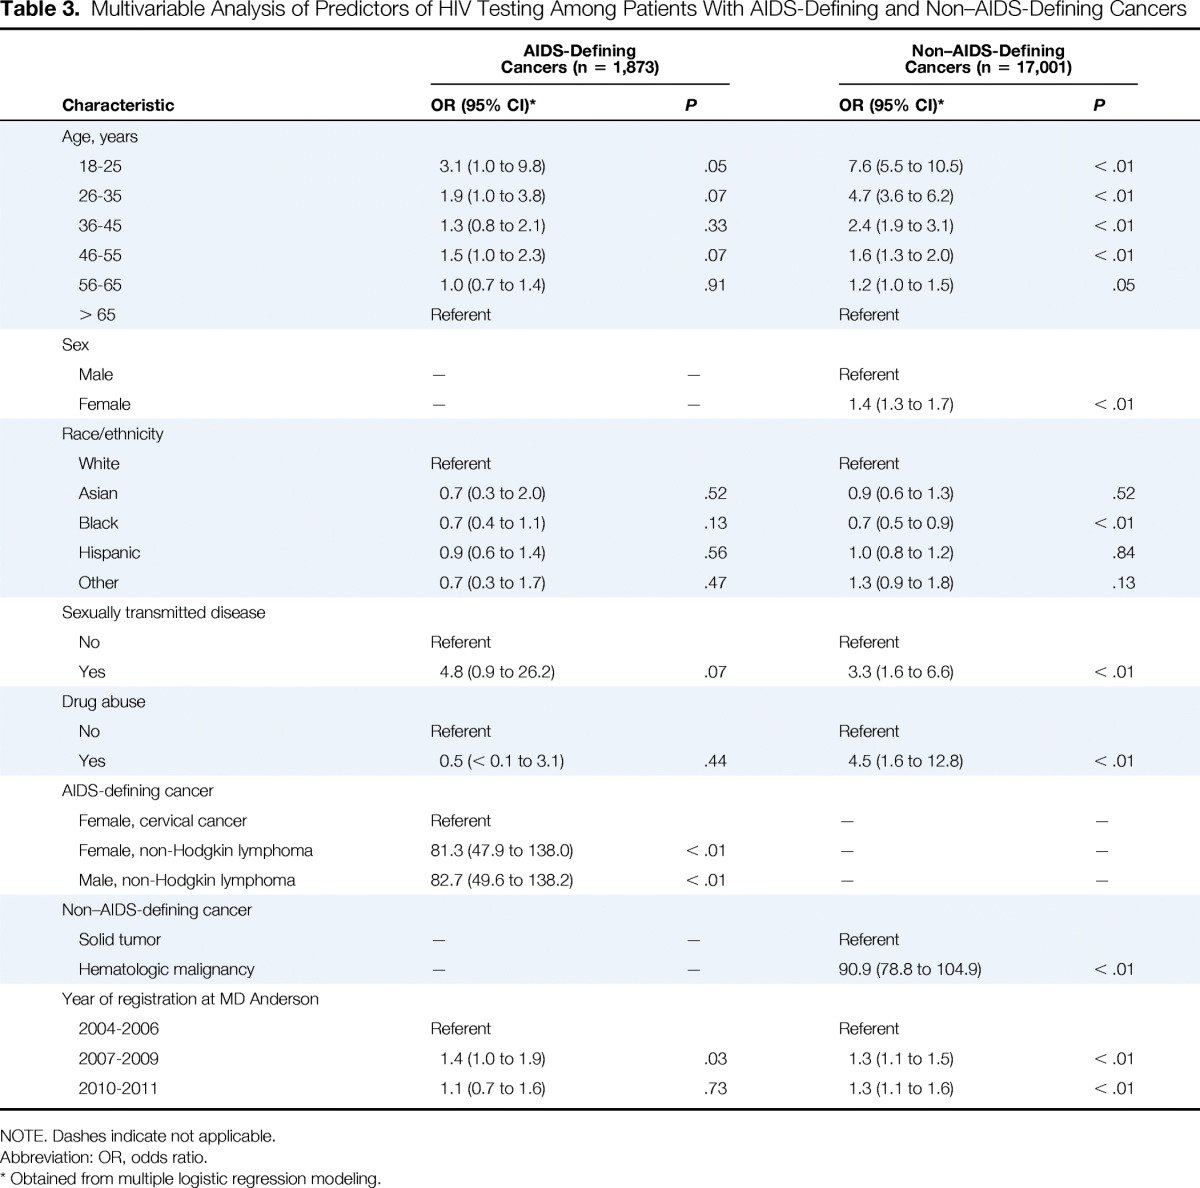
Table 3.
Multivariable Analysis of Predictors of HIV Testing Among Patients With AIDS-Defining and Non–AIDS-Defining Cancers

| Characteristic | AIDS-Defining Cancers (n = 1,873) |
Non–AIDS-Defining Cancers (n = 17,001) |
||
|---|---|---|---|---|
| OR (95% CI)* | P | OR (95% CI)* | P | |
| Age, years | ||||
| 18-25 | 3.1 (1.0 to 9.8) | .05 | 7.6 (5.5 to 10.5) | < .01 |
| 26-35 | 1.9 (1.0 to 3.8) | .07 | 4.7 (3.6 to 6.2) | < .01 |
| 36-45 | 1.3 (0.8 to 2.1) | .33 | 2.4 (1.9 to 3.1) | < .01 |
| 46-55 | 1.5 (1.0 to 2.3) | .07 | 1.6 (1.3 to 2.0) | < .01 |
| 56-65 | 1.0 (0.7 to 1.4) | .91 | 1.2 (1.0 to 1.5) | .05 |
| > 65 | Referent | Referent | ||
| Sex | ||||
| Male | — | — | Referent | |
| Female | — | — | 1.4 (1.3 to 1.7) | < .01 |
| Race/ethnicity | ||||
| White | Referent | Referent | ||
| Asian | 0.7 (0.3 to 2.0) | .52 | 0.9 (0.6 to 1.3) | .52 |
| Black | 0.7 (0.4 to 1.1) | .13 | 0.7 (0.5 to 0.9) | < .01 |
| Hispanic | 0.9 (0.6 to 1.4) | .56 | 1.0 (0.8 to 1.2) | .84 |
| Other | 0.7 (0.3 to 1.7) | .47 | 1.3 (0.9 to 1.8) | .13 |
| Sexually transmitted disease | ||||
| No | Referent | Referent | ||
| Yes | 4.8 (0.9 to 26.2) | .07 | 3.3 (1.6 to 6.6) | < .01 |
| Drug abuse | ||||
| No | Referent | Referent | ||
| Yes | 0.5 (< 0.1 to 3.1) | .44 | 4.5 (1.6 to 12.8) | < .01 |
| AIDS-defining cancer | ||||
| Female, cervical cancer | Referent | — | — | |
| Female, non-Hodgkin lymphoma | 81.3 (47.9 to 138.0) | < .01 | — | — |
| Male, non-Hodgkin lymphoma | 82.7 (49.6 to 138.2) | < .01 | — | — |
| Non–AIDS-defining cancer | ||||
| Solid tumor | — | — | Referent | |
| Hematologic malignancy | — | — | 90.9 (78.8 to 104.9) | < .01 |
| Year of registration at MD Anderson | ||||
| 2004-2006 | Referent | Referent | ||
| 2007-2009 | 1.4 (1.0 to 1.9) | .03 | 1.3 (1.1 to 1.5) | < .01 |
| 2010-2011 | 1.1 (0.7 to 1.6) | .73 | 1.3 (1.1 to 1.6) | < .01 |
NOTE. Dashes indicate not applicable.
Abbreviation: OR, odds ratio.
Obtained from multiple logistic regression modeling.
