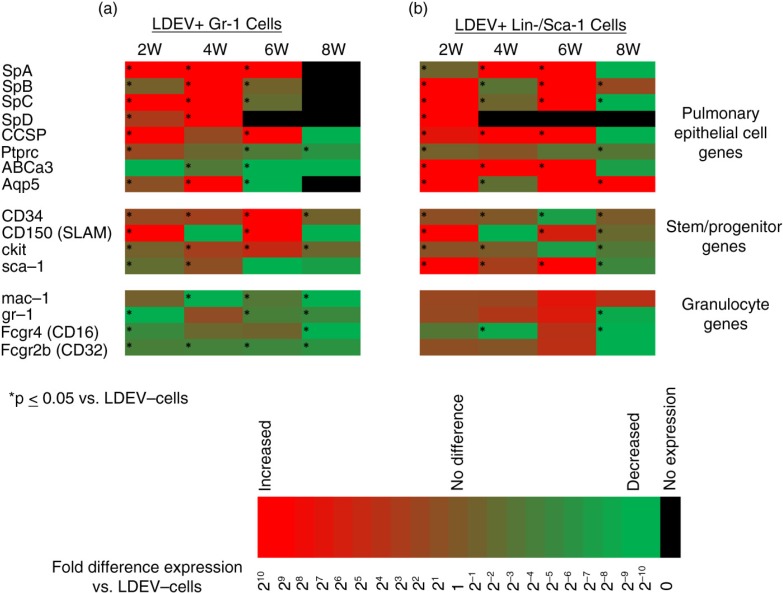
Fig. 4.
Gene expression profile of LDEV+ Gr-1+ and Lin-/Sca-1+ cells in long-term culture. Expression of pulmonary epithelial cell genes, stem/progenitor cell genes and granulocyte genes in (a) Gr-1+ cells and (b) Lin-/Sca-1+ cells that are LDEV+ relative to cells that are LDEV−. Cells were cultured for 2, 4, 6 or 8 weeks (5.3×10⁴ cells/cm2). Gene expression changes relative to LDEV− cells are displayed as heat maps using a base 2 logarithmic scale. Cell culture experiments performed 3 times, and fold expression values are an average of all 3 experiments. *p > 0.05 (Student's t-test), gene expression versus control cells.

