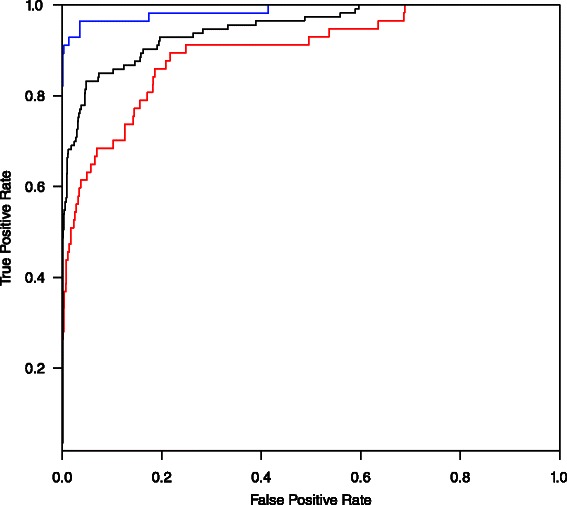
Fig. 2.

ROC curves of predictions on the NP+/P-, P+/P- and OP+/P- datasets using default predictor. Blue, black and red ROC curves represent the performance on the NP+/P-, P+/P- and OP+/P- datasets, respectively

ROC curves of predictions on the NP+/P-, P+/P- and OP+/P- datasets using default predictor. Blue, black and red ROC curves represent the performance on the NP+/P-, P+/P- and OP+/P- datasets, respectively