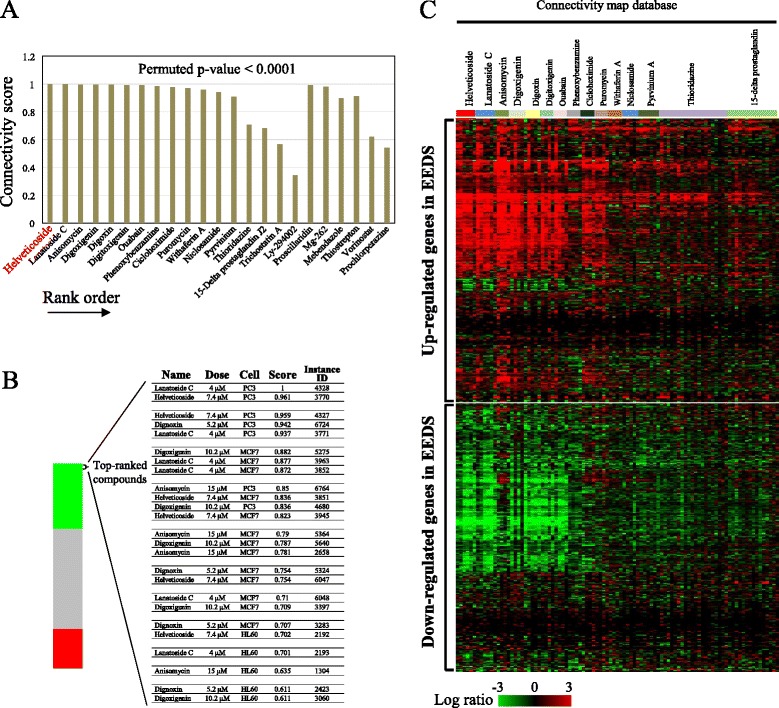
Fig. 1.

Enrichment analyses for EEDS using the Connectivity map. a The Connectivity map was queried using 275 up- and 193 down-regulated genes in A549 cells after EEDS treatment (Additional file 1) as up- and down-tags, respectively. The resultant connectivity scores of the 23 top-ranked chemicals (permutated p-value < 0.0001) were plotted in the order of rank. b The position of an individual treatment instance with the five top-ranked chemicals is plotted in the bar graph, which was constructed from 6,100 individual chemicals ordered by their corresponding connectivity scores from +1 (top) to −1 (bottom). The green, gray and red colors reflect the positive, null, and negative signs of the scores, respectively. The dose, cell line, connectivity score, and name (instance ID) of each individual instance included in the top five chemicals are shown. c A comparison of the EEDS-responsive gene expression profile with that obtained for several top-ranked chemicals is shown. The columns and rows represent individual samples and genes, respectively. The color scale for the expression ratio ranges from red (high) to green (low) as indicated by the scale bar.
