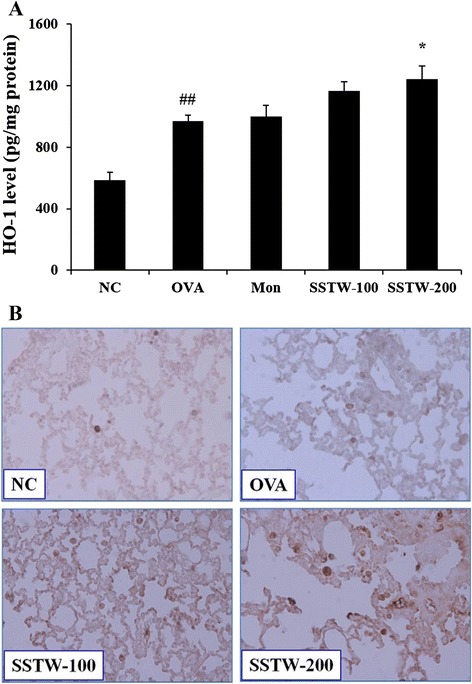
Fig. 5.

Effects of SSTW on HO-1 level and protein expression. Data were obtained using (a) ELISA analysis and (b) immunohistochemistry. NC, normal control group (PBS only); OVA, OVA-induced group; Mon, montelukast (30 mg/kg) + OVA-induced group; SSTW-100, SSTW (100 mg/kg) + OVA-induced group; SSTW-200, SSTW (200 mg/kg) + OVA-induced group. Each bar represents the mean ± SEM (n = 6 per group). Significant differences at ## P < 0.01 compared with the NC group. Significant differences at * P <0.05 compared with the OVA-induced group
