Fig. 7.

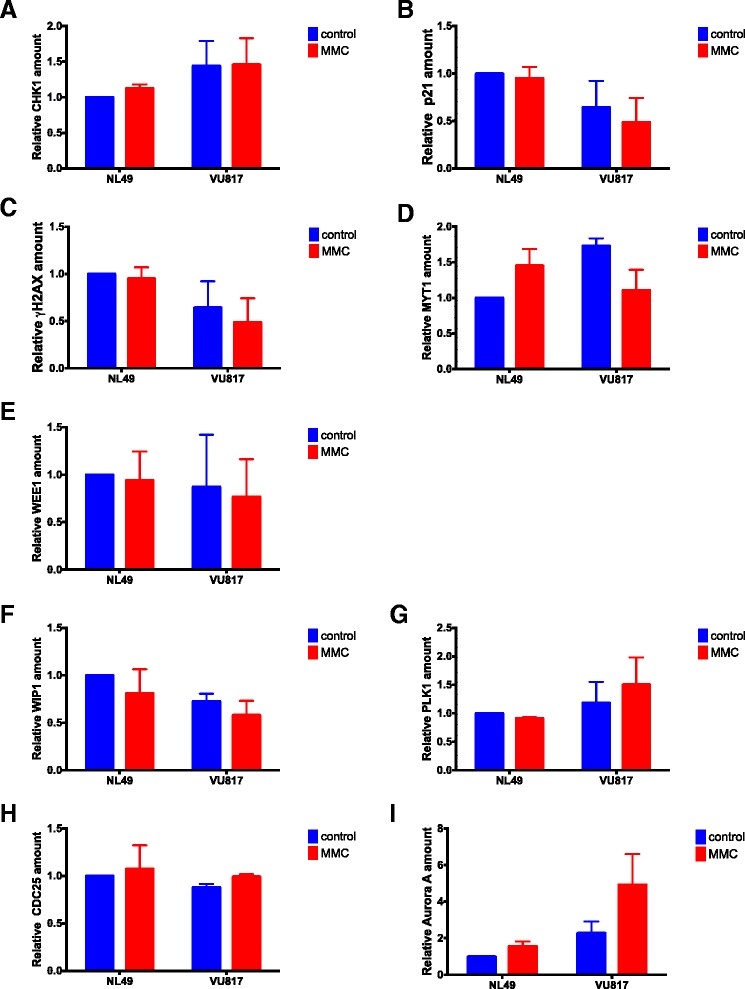
Western Blot densitometry analysis. Checkpoint proteins (a–e) and CHKREC proteins (f–i). (n = 3 independent experiments). No statistically significant differences were found in the protein expression patterns among groups

Western Blot densitometry analysis. Checkpoint proteins (a–e) and CHKREC proteins (f–i). (n = 3 independent experiments). No statistically significant differences were found in the protein expression patterns among groups