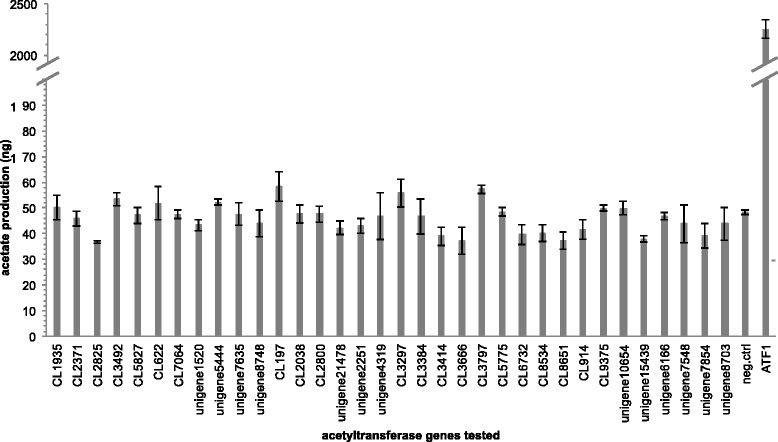
Fig. 10.

Functional assay of putative acetyltransferase genes. Y-axis represents the total amount of acetate esters (sum of Z5-10:OAc, Z7-12:OAc, and Z9-14:OAc) produced by the yeast cells transformed with candidate genes (±95 % confidence interval, n = 3). Negative control is yeast cell (∆ATF1) transformed with empty vector and the yeast strain overexpressing ATF1 gene serves as positive control. None of the 34 candidate genes produces significantly higher amount of acetate esters compared to the negative control (overlapping 95 % confidence intervals), whereas the ATF1 produces a 45-fold increase in acetate production
