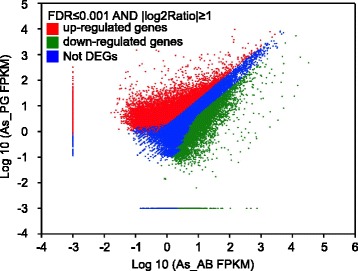
Fig. 2.

Differentially expressed unigenes displayed by FPKM in As_PG versus As_AB, in log10 scale. X-axis (As_AB) and Y-axis (As_PG) shows the logarithm value of normalized expression of each gene in FPKM (Fragments per kb per Million fragments). There are 21,965 unigenes that are up regulated (red dots), measured by As_PG(FPKM)/As_AB(FPKM) > 2. On the contrary, 14,292 unigenes are down regulated (green dots), since their As_PG(FPKM)/As_AB(FPKM) < 0.5. Most of the unigenes, 25,895, were equally expressed (blue dots) in both tissue (0.5 < As_PG(FPKM)/As_AB(FPKM) < 2)
