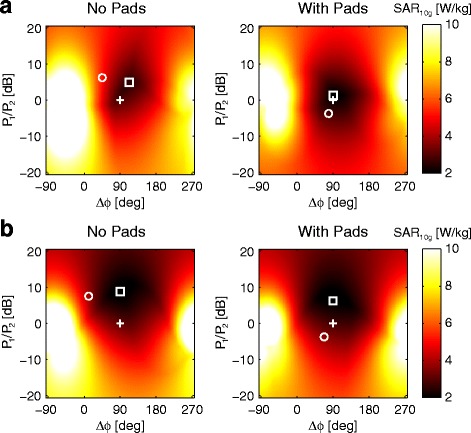
Fig. 4.

Variation of local torso SAR with RF-shim settings simulated in the “Duke” (a) and “Ella” (b) body models, with and without high permittivity pads. In each plot, quadrature mode is indicated with the plus sign (+) and the shim setting which minimizes local torso SAR by the box (□). For reference, the shim setting that maximizes B 1 + homogeneity is indicated by the circle (o), as previously shown in Fig. 2. All data are normalized to the mean B 1 + in the transverse cross-section of the body
