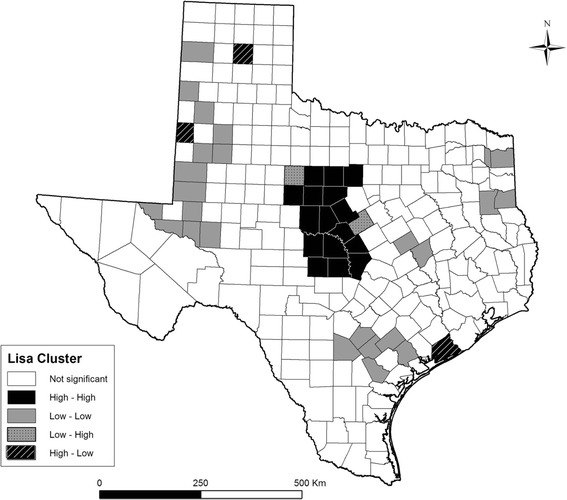
Fig. 3.

Cluster map of Local Indicators of Spatial Association (LISA) of Lyme disease in Texas based on the empirical Bayesian smoothed incidence estimates. The high-high and low-low locations are spatial clusters (hot and cold spots, respectively) while low-high and high-low associations are spatial outliers. A significance level of 0.05 was used.
