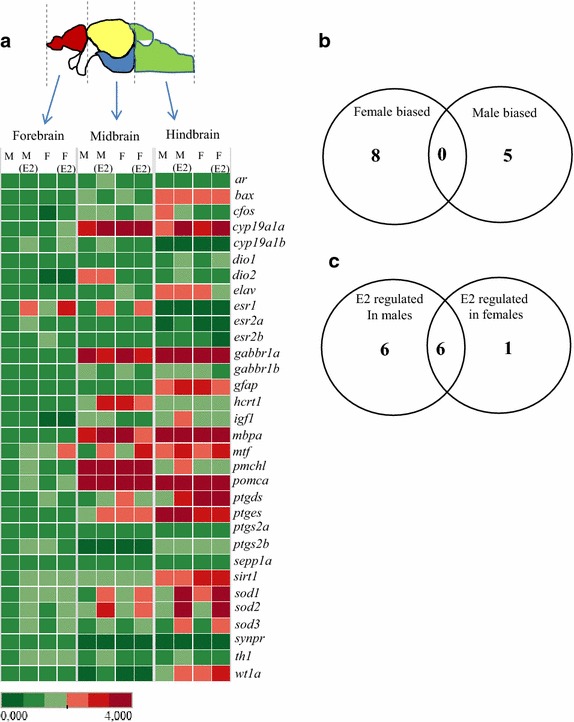
Figure 2.

qRT-PCR array. Male and female zebrafish (n = 4 for each sex) were exposed separately to 25 nM E2 for 24 h and the brain tissue was isolated and dissected into three regions. RNA was isolated from individual samples followed by qRT-PCR analysis of 32 genes. a Tableau software was used to generate the heat map. The scale bar represents magnitude of expression with male sample from forebrain set to 1 and highest expression fixed to 4. b Venn-diagram showing the sexually dimorphic genes with higher expression of 8 genes in females while only 5 genes were male biased. 19 genes did not show sexually dimorphic expression patterns. c Venn-diagram showing E2 mediated dimorphic gene expression with six genes being regulated in males only, six genes being regulated in both sexes and one gene being regulated in females only.
