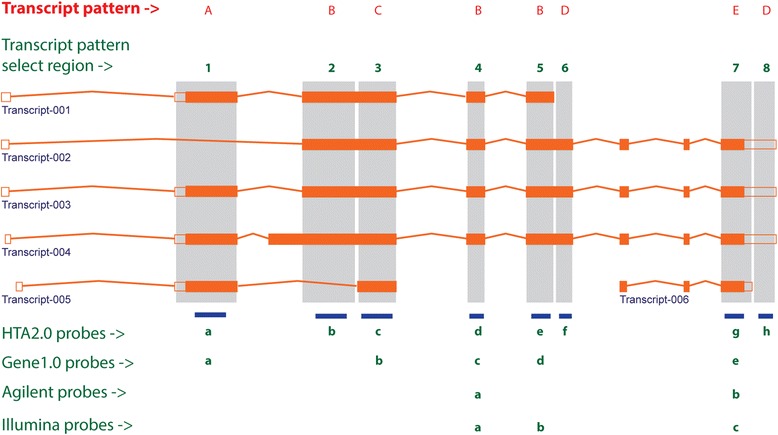
Fig. 1.

Diagram of transcript patterns defined in the current study. A transcript pattern select region covers a set of transcripts that share a certain exon or exon region recognized by a probe. The model gene in this diagram is TBP (exon/intron size modified for illustration purpose). If we consider, for example, Affymetrix probe a, which targets transcript pattern selection region #1 that covers a set of transcripts 001 and 003–005 but transcript 002 is excluded, defines the transcript pattern A. Thus, signals from Affymetrix HTA2.0 probes b, d, and e, from Gene1.0 probes c and d, from Agilent probes a, and from Illumina probes a and b will be used to summarize the expression level of the common transcript pattern B within a platform. Further, because the transcript patterns B and E are common across all microarray platforms they are kept in the transcript pattern derived subset data as two separate data points although they represent the expression level of the same specific gene (TBP)
