Fig. 2.

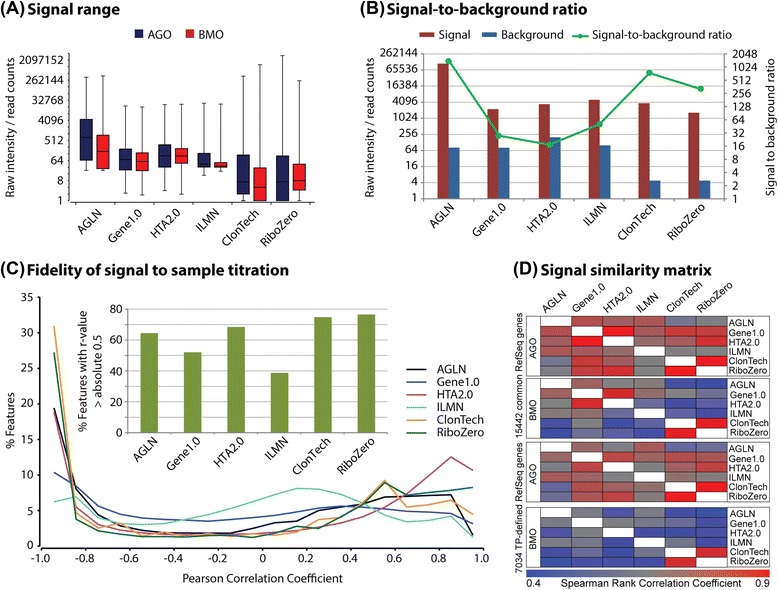
(a) raw signal range of two pure RNA samples (AGO and BMO) with the entire data set, represented by Box-Whisker plot (max, 75 %, median, 25 % and min); (b) signal-to-background ratio, indicated by 99 percentile of mean signal and background values determined with entire set of raw data in all 5 RNA samples; (c) fidelity of signal to sample titration by correlation, showing full distribution of coefficient of correlation between signal and titration across the 5 RNA samples in the entire set of raw data, with the emphasis on the percent of features (probes/probesets for microarray, genes for RNA-seq) with a correlation coefficient greater than absolute 0.5; (d) signal similarity matrix of AGO and BMO samples across all 6 platforms were generated with Spearman rank correlation using signal/count data of RefSeq gene symbol aligned 15442 genes and transcript pattern defined 7034 genes
