
Fig. 3.
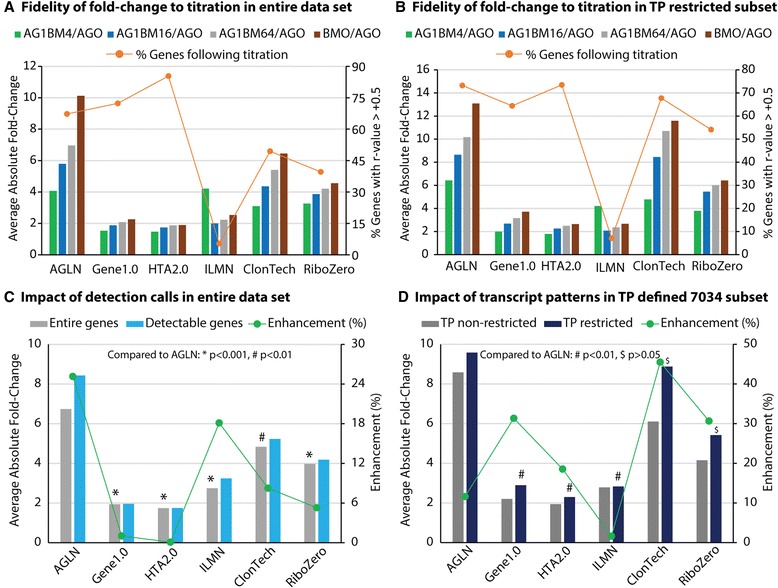
Bar charts for platform comparisons on magnitude of differential expressions determined by average absolute fold-change. Average absolute fold-change was analyzed for each titration across all 6 platforms in entire data set (a) as well as in transcript pattern (TP) restricted 7,034 subset (b). To ascertain the magnitude of differential expression for a platform as a whole, the 4 average absolute fold-changes of the full titrations were averaged in both entire genes and detectable genes in the entire data set (c), as well as in TP non-restricted and restricted 7,034 RefSeq genes subsets (d). To gauge platform fidelity level in fold-change along sample titrations, percent of genes with a Pearson correlation > +0.5 was indicated in the panels (a) and (b). In addition, the fold-change enhancement was indicated with dotted lines in green in panels (c) and (d) that was determined as the difference in average absolute fold-change between the bar elements from left to right for each platform. Moreover, the statistics were placed in the panels (c) and (d) for the difference in average fold-change from AGLN to the other platforms for the entire set of data and for the TP-defined subset of data. When compared to AGLN, the average absolute fold-change was significantly lower in all platforms (p < 0.01–0.001) in the data set for entire genes, and such difference was statistically significant to 3 microarray platforms (p < 0.01) but not to the RNA-seq protocols (p > 0.05) in the TP restricted 7,034 subset