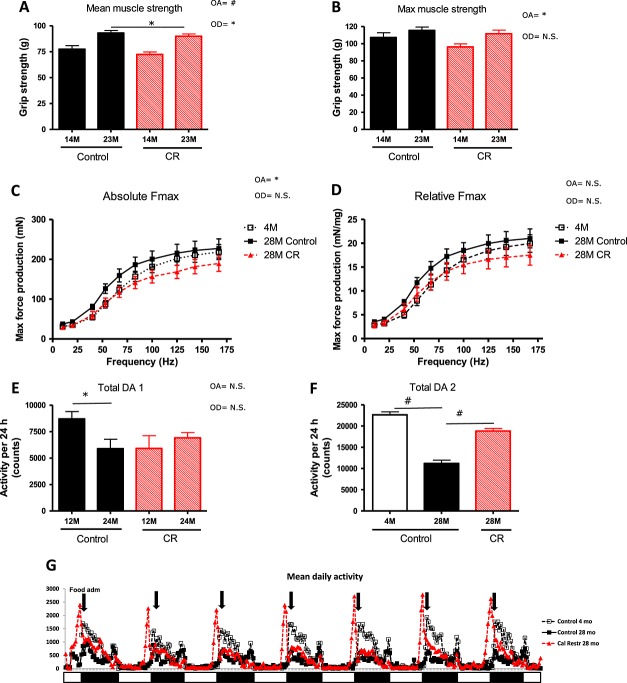
Figure 3.
Locomotor function: muscle strength and daily activity of the mice on the different diet interventions during ageing. (A) Mean grip strength (mean of three median measurements out of five) and (B) maximal grip strength. Mixed model: overall and per age group no diet effect. Overall age effect: P = 0.02 but not in separate groups. (C) Maximal force production. Mixed model: difference on age (P < 0.05) but not on diet. (D) Relative force frequency. (E) Mean daily activity of the mice of 12 and 24 months of age. The data represented in this figure are from the same set of animals and can therefore also be compared towards a decrease or increase in activity in time. (F) Mean daily activity of the mice of 28 months of age when compared with the animals of 4 months of age, which were investigated at the same time. (G) An example from the mean of the raw data from 28 months. The sample is also the representative for the data found at 24 months. White and black boxes represent the light and dark periods. #P < 0.001; §P < 0.01; *P < 0.05. OA, overall age effect; OD, overall diet effect; CR, caloric restricted; n.s., no significance.

