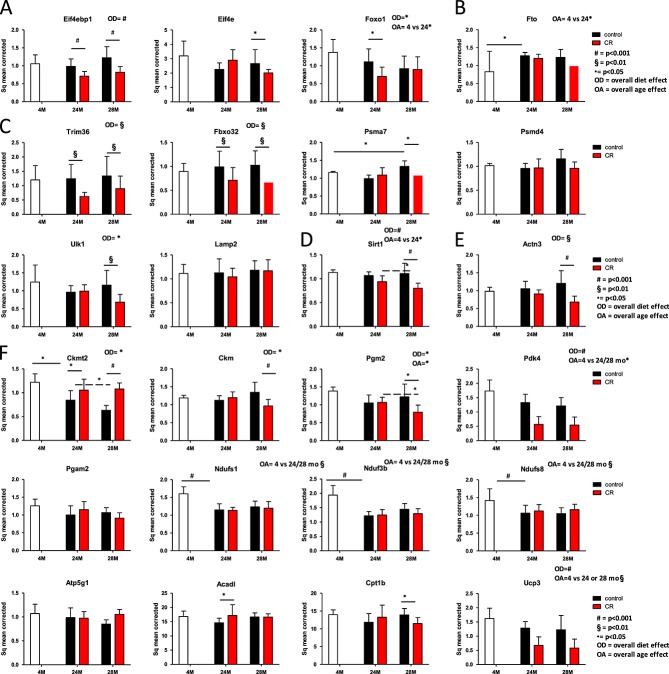
Figure 5.
Gene expression profiles in musculus tibialis, depicted per pathway. On all data, a mixed model analysis was performed. Overall significances are depicted above the picture, within group significances are depicted with lines and symbols indicating the level of significance of the P-value. (A) Muscle protein synthesis. (B) Amino acid sensing. (C) Muscle protein breakdown. (D) Sirtuin 1. (E) Indication of fibre-type switch. (F) Energy metabolism. CR, caloric restricted.

