
Figure 6.
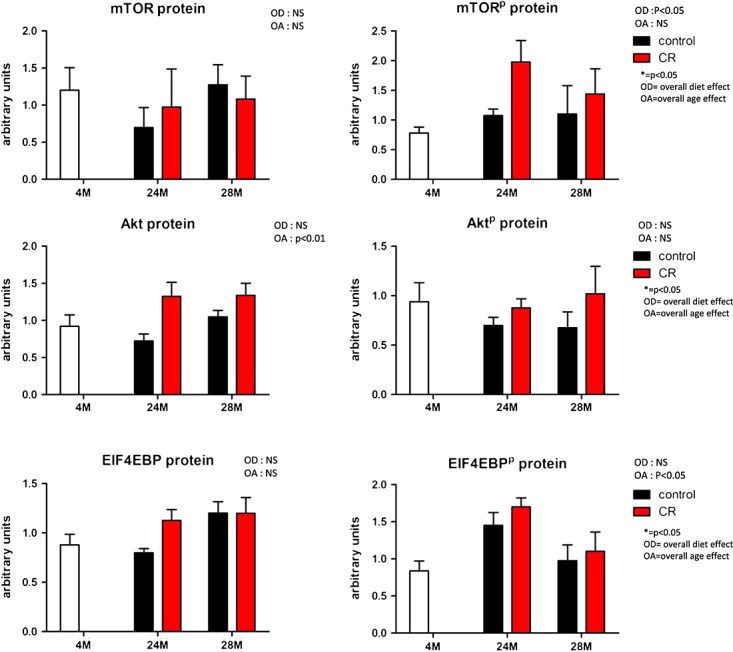
Protein levels of key regulator proteins of the mammalian target of rapamycin (mTOR) pathway both in unphosphorylated and phosphorylated forms. On all data, a mixed model analysis was performed. Overall significances are depicted above the picture, within group significances are depicted with lines and symbols indicating the level of significance of the P-value. OA, overall age effect; OD, overall diet effect; CR, caloric restricted.