
Figure 8.
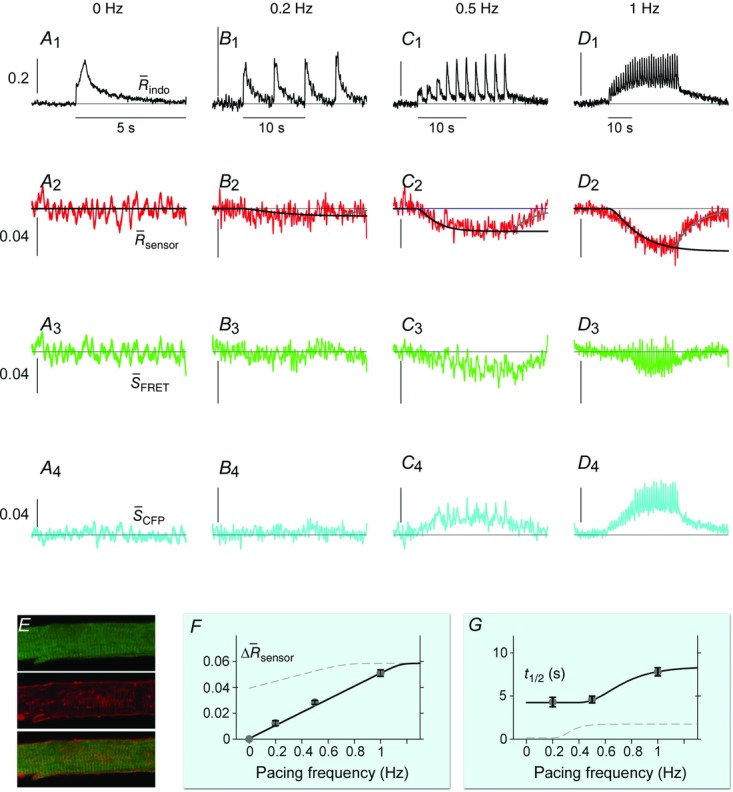
DuoCaN activation in response to field stimulation in aGPVMs
A–D, indo-1 and DuoCaN sensor signals from an exemplar cell are shown. A, a single pulse elicits a calcium transient (A1, black). The sensor is not activated and  sensor remains at the baseline (A2, red). Scale bar indicates normalized change of the signal throughout. Normalized CFP (A2) and FRET (A3) channels are silent. B, stimulation at 0.2 Hz results in calcium transients in the cell (B1). The corresponding sensor response is shown (B2) illustrating a small decrease (∼0.005); the fit to activation (solid black) and inactivation (solid grey) is indicated. Individual FRET (B3) and CFP (B4) channel signals are shown with the change largely masked by motion artifacts. C, a 0.5 Hz stimulation train elicits calcium transients gradually increasing in amplitude, with upward shifting baseline indicating calcium summation (C1). This in turn activates the sensor as is apparent from the change in FR (C2). Corresponding FRET (C3) and CFP (C4) channels are also shown. D, pacing at 1 Hz for 30 s leads to a robust increase in sensor activation (D2) with subsequent decline to the basal level after the pacing was turned off. Individual FRET (D3) and CFP (D4) channels are shown. Strong motion artifacts are present in each individual signal and disappear in
  sensor (D2). E, DuoCaN sensor expression and distribution in aGPVMs evaluated by imaging through CFP channel (green) and di-4-ANEPPS (red). The sensor is located in the vicinity of T-tubules, as demonstrated by the overlay of the two channels (bottom). F, population data of sensor activation versus stimulation frequencies are plotted (grey filled circles and solid black line for the trend-line, average of n = 4–10 cells for each point). The sensor activation shows a gradual rise in amplitude as the pacing rate is increased. The aGPVMs are contrasted with the corresponding nearly flat NRVM trend-line (dashed-grey). G, the half-time to activation from quiescent state in aGPVMs is around 5 s at 0.5 Hz and 10 s at 1 Hz (black filled circles and black line), which is about 5 times slower than that of NRVMs (dashed grey line).