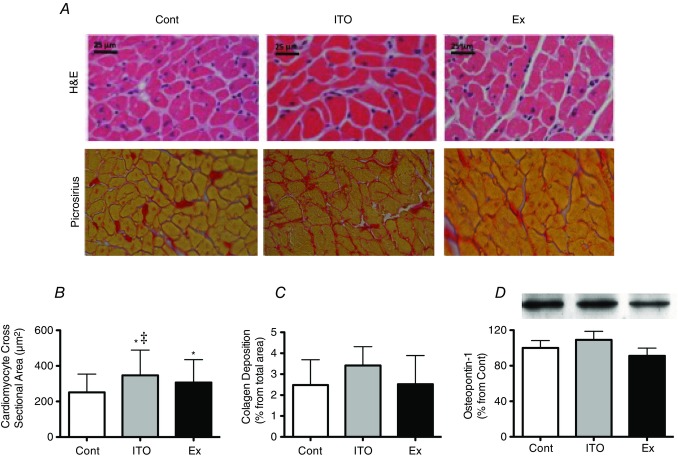
Figure 4.
Effects of the different chronic protocols on hypertrophy and fibrosis:
A (upper) and B, cardiomyocyte hypertrophy. A (lower) and C, fibrosis. D, osteopontin-1 protein levels. The Four random microscopic fields of LV from five animals per group were considered for histological analysis. Four independent experiments containing two different samples from each group were considered for protein analysis. Error bars indicate the mean ± SD. *P < 0.05 vs. Cont; ‡P < 0.05 vs. Ex.

