
Figure 1.
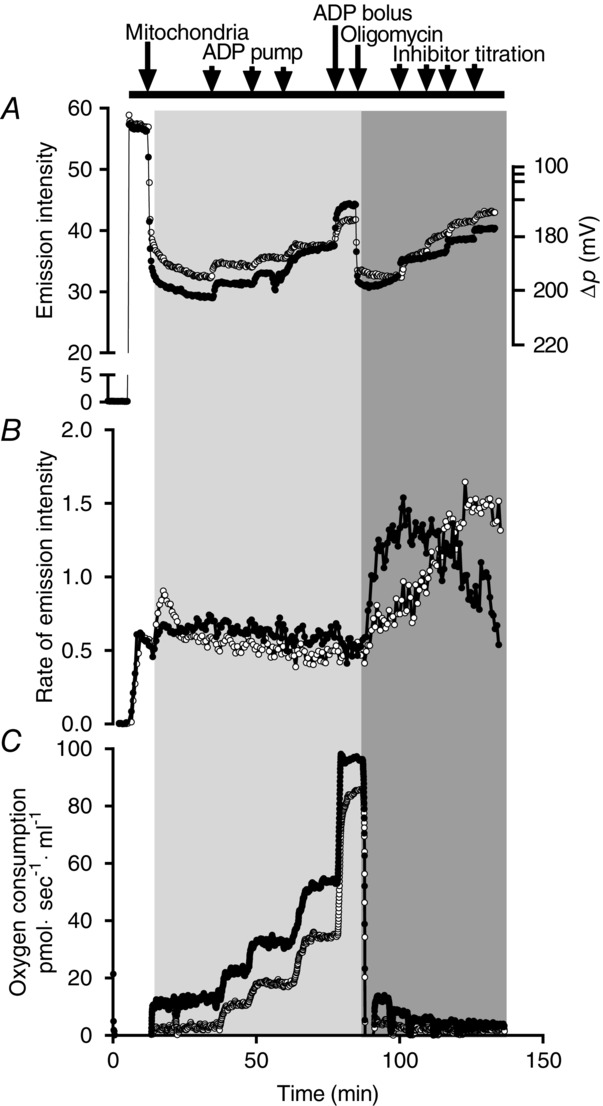
Protocol and representative traces
Mitochondrial membrane potential using TMRM (A), Rate of H2O2 emission using Amplex Red, HRP and SOD (B) and respiration (C). Black filled circles (•) indictate when using SR (with malonate as an inhibitor) and open circles (○) indictate when using PM (with rotenone as an inhibitor). The light grey area represents the phosphorylating part of the protocol and the darker grey area represents the non-phosphorylating part. Traces are from an aged trained subject.