
Figure 4.
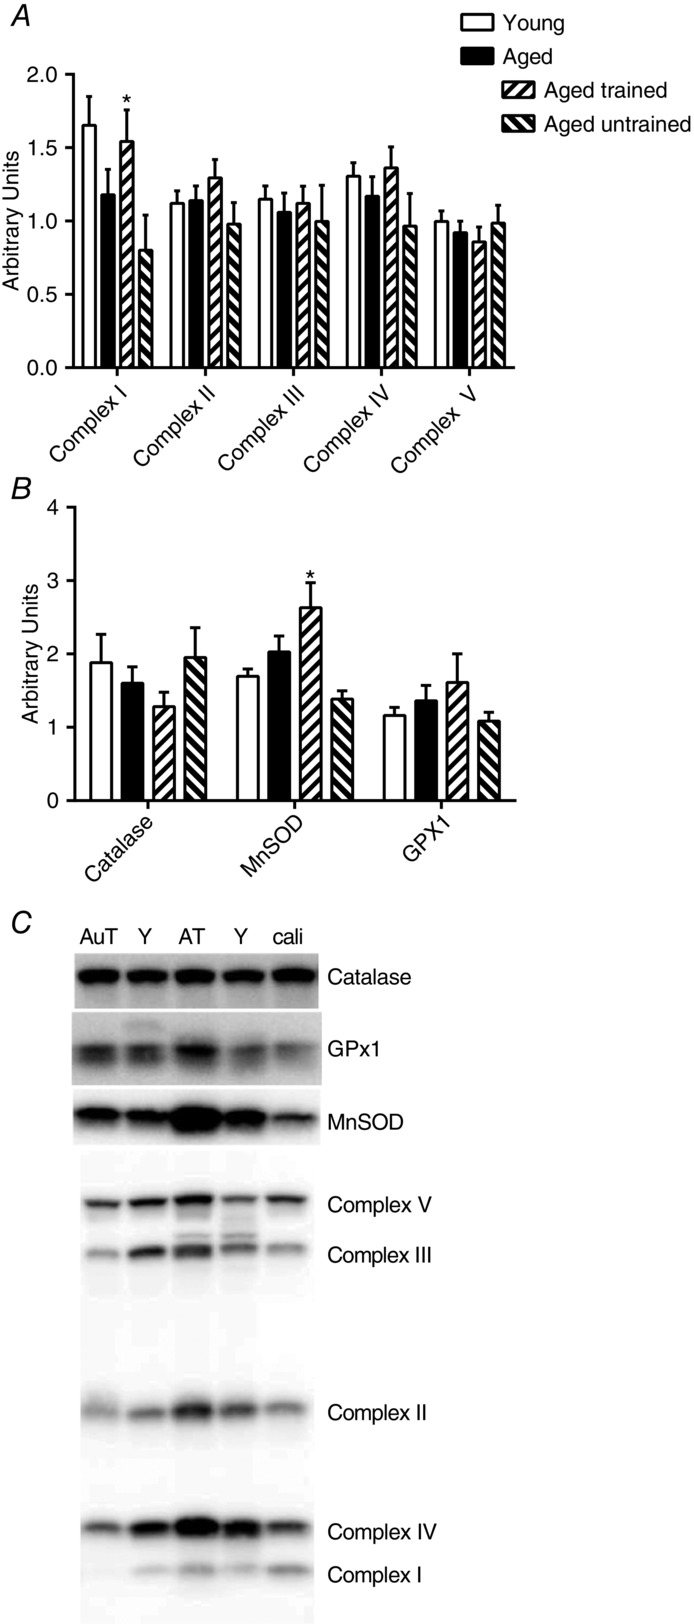
Muscle analyses
Whole muscle protein content of mitochondrial complex I–V (A), catalase, MnSOD and glutathion peroxidase (GPx1) (B) and representative western blots (C). Data in (A) and (B) are the mean ± SEM. Young (Y), aged untrained (AuT), aged trained (AT) and the calibration lane (cali) are shown in (C). *Significant effect of training status within the aged group of subjects (P < 0.05).