
Figure 7.
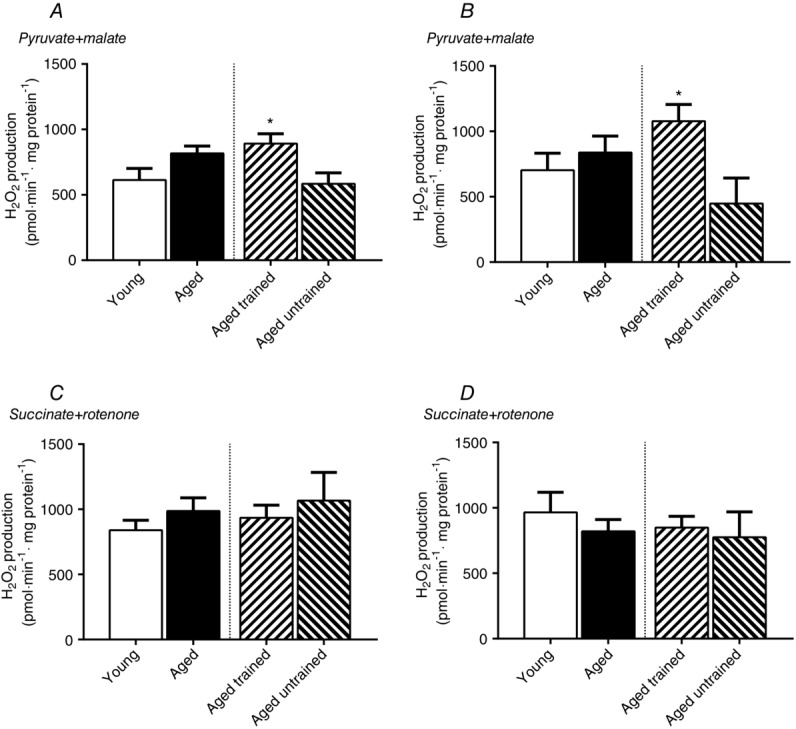
H2O2 emission at fixed relative and absolute membrane potential
H2O2 emission during non-phosphorylating conditions at 50% (A and C) of the available phosphorylating membrane potential and at a predefined absolute (175 mV) membrane potential (B and D). (A) and (B) represent data when using PM and (C) and (D) represent data when using SR. All measurements are related to mg of mitochondrial protein. Data are the mean ± SEM. The aged bar represents pooled data from the trained and untrained group of aged subjects. *Significant effect of training status within the aged group of subjects (P < 0.05).