
Figure 7.
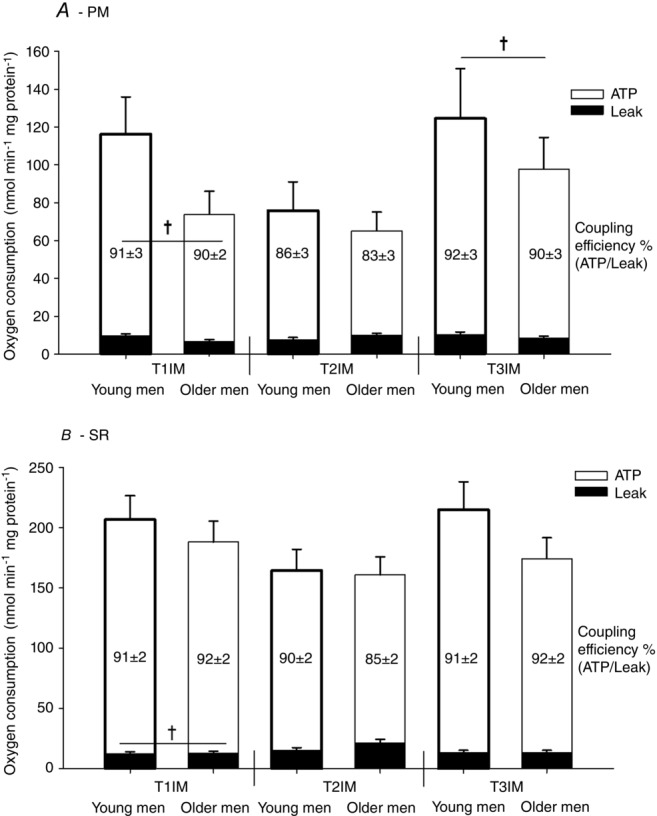
Respiration at a predefined absolute membrane potential
Two protocols: (A) pyruvate + malate (PM; 172.5 mV) and (B) succinate + rotenone (SR; 179 mV) were used. T1IM is at inclusion, T2IM is after immobilization and T3IM is after 6 weeks of aerobic training in the immobilized leg. Results for the non-immobilized control leg (T2CON) are not shown. Numbers in bars are the coupling efficiency calculated as ATP generating respiration (white bars) as a percentage of the total respiration. Leak respiration is represented by black bars. The results are presented as the mean ± SEM. † vs. T2IM (P < 0.05; main effect).