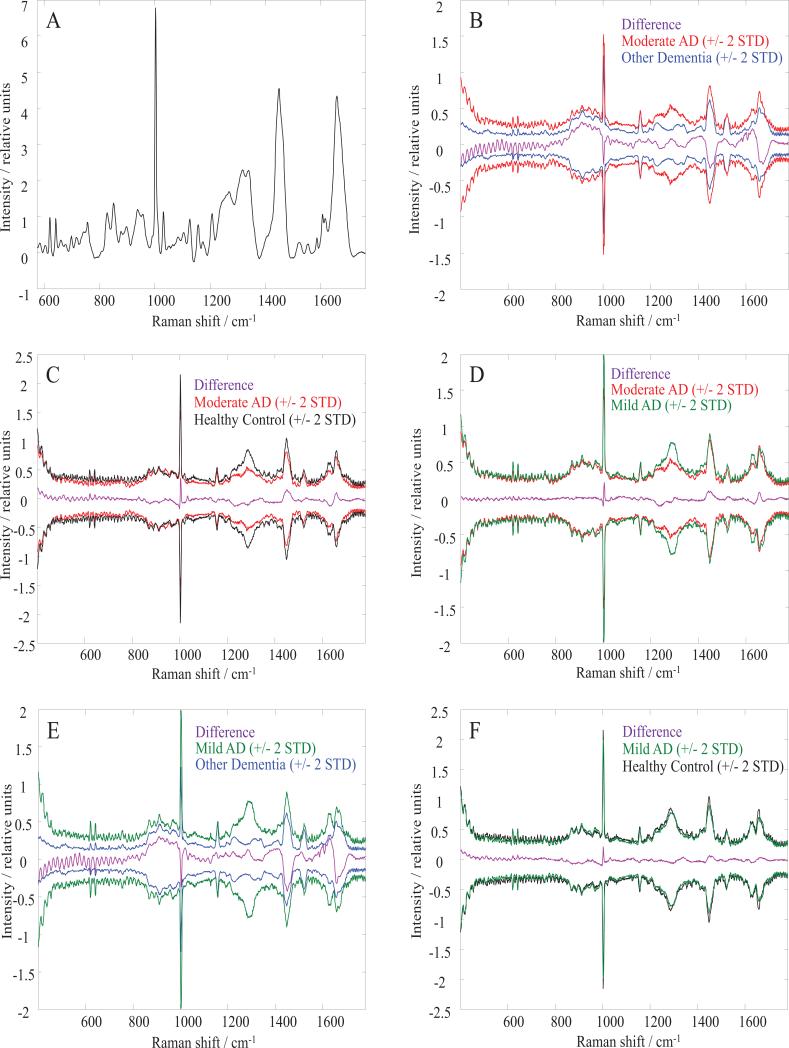
Figure 1.
Average and difference Raman spectra of human blood serum.
(A) An average Raman spectrum of human blood serum obtained for healthy controls. Difference average spectra (purple lines) and spectral variations around the mean (+/-2 STD) for: (B) moderate Alzheimer's dementia and other dementia; (C) moderate Alzheimer's dementia and healthy controls; (D) moderate and mild Alzheimer's dementia cohorts; (E) mild Alzheimer's dementia and other dementia; (F) mild Alzheimer's dementia and healthy controls.

