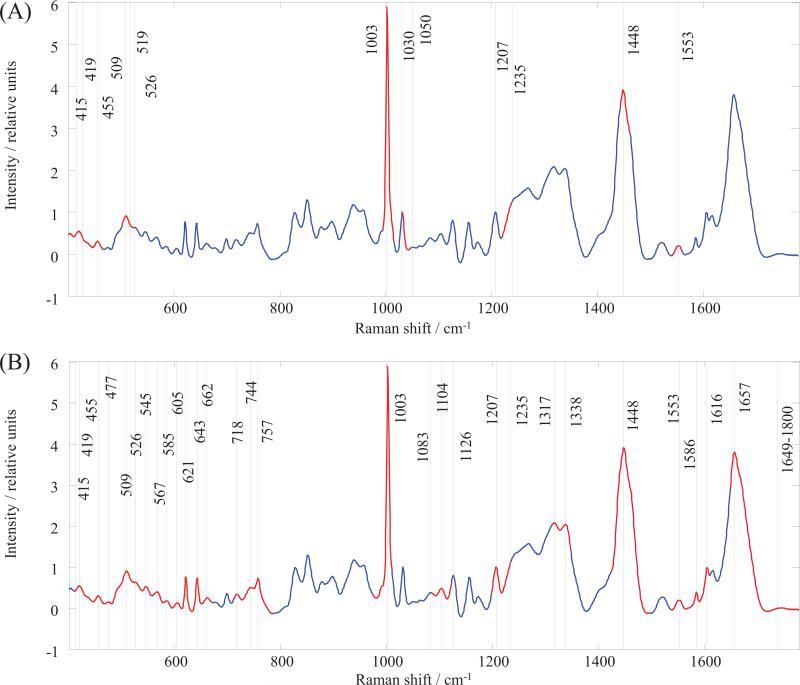
Figure 2.
Raman spectral regions and bands identified by Genetic Algorithm (GA) as providing the highest discriminatory power between the serum samples. (A) Alzheimer's dementia versus healthy controls; (B) Alzheimer's dementia versus other dementias. The GA regions highlighted in red on the total average spectrum of the human blood serum (blue).

