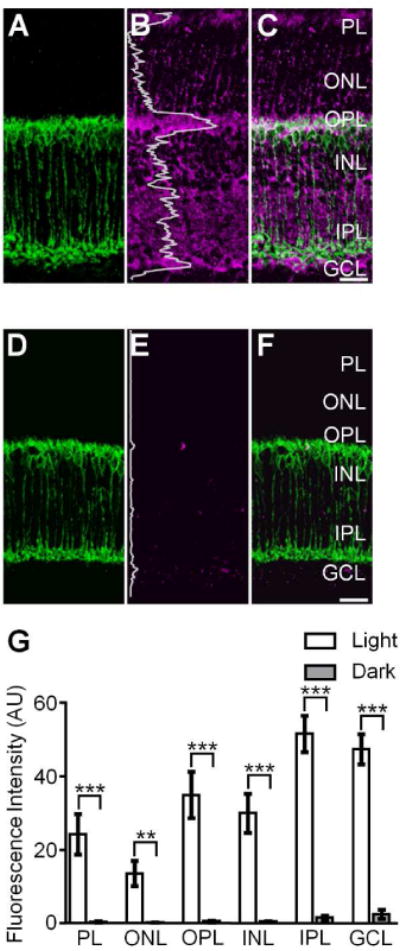
Figure 2.

S-nitrosocysteine immunofluorescence in confocal images of vertical cryostat sections from light- and dark-adapted wild-type mouse retinas. A, D: PKCα positive rod bipolar cells (RBCs, green) in the light- and dark-adapted wild-type mouse retina. B: Confocal image of the same region presented in A showing SNI (magenta) was present in all retinal layers of the light-adapted wild-type mouse retina. The relative amount and location of S-nitrosylated proteins in the light-adapted retina was illustrated by the fluorescence intensity (the gray superimposed trace) which was integrated horizontally across the image. C: Merged image of A and B showing the robust S-nitrosocysteine labeling pattern across all retinal layers. Note the colocalization of SNI and PKCα + RBCs. E: Confocal image of the same region represented in D showing SNI in the dark-adapted wild-type mouse retina. The superimposed gray trace illustrates the fluorescence intensity plot of the SNI and indicates a substantial reduction of S-nitrosocysteine + label in the dark-adapted wild-type mouse retina as compared to the light-adapted retina. Of note: confocal images in B and E were obtained using the exact same laser power settings and the intensity plot profiles in B and E are plotted on the same scale. F: Merged image of D and E illustrating the faint and nearly absent S-nitrosocysteine labeling pattern in in the dark-adapted wild-type mouse retina. G: Summary graph illustrating S-nitrosylation, as determined by the fluorescence intensity of SNI, is significantly greater in every retinal layer of the light-adapted wild-type mouse retina as compared to the dark-adapted wild-type mouse retina. Unpaired Student’s t test, ***: p≤0.0005, **: p≤0.005, light-adapted: n=8 retinas, dark-adapted: n=6 retinas. Data is presented as mean ± SEM. Scale bars=20 μm.
