
Figure 2.
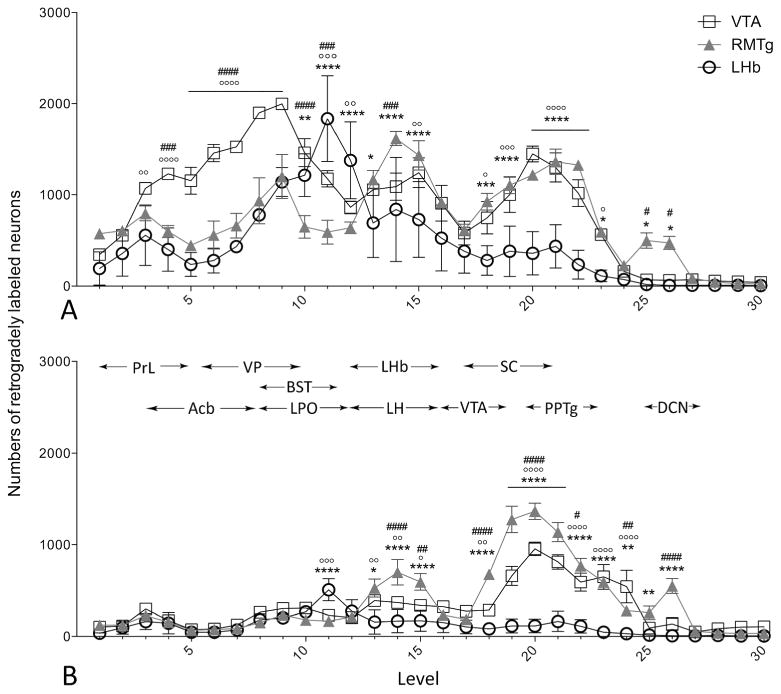
Graphs depicting numbers of VTA-, RMTg-, and LHb-projecting neurons along the rostrocaudal axis of the brain. Shown are means± SEM of numbers of retrogradely labeled neurons per brain section on the ipsilateral (A) and contralateral (B) sides relative to the injection site in rats injected into the VTA (open boxes), RMTg (closed triangles), and LHb (open circles). Approximate rostral and caudal limits of a number of relevant brain structures are indicated by horizontal arrows at the top of panel B. Abbreviations (left to right): PrL: prelimbic cortex (cx); Acb: nucleus accumbens; VP: ventral pallidum; BST: bed nucleus stria terminals; LPO: lateral preoptic area; LHb: lateral habenula; LH: lateral hypothalamus; VTA: ventral tegmental area; SC: superior colliculus; PPTg: pedunculopontine tegmental nucleus; DCN: deep cerebellar nuclei. VTA vs. LHb: °p < 0.05, °°p < 0.01, °°°p < 0.001, °°°°p < 0.0001; VTA vs. RMTg: #p < 0.05, ##p < 0.01, ###p < 0.001, ####p < .0001; RMTg vs. LHb: *p < 0.05, **p < 0.01, *** p < 0.001, **** p < 0.0001. Results of the ANOVAs are given in Table 2.